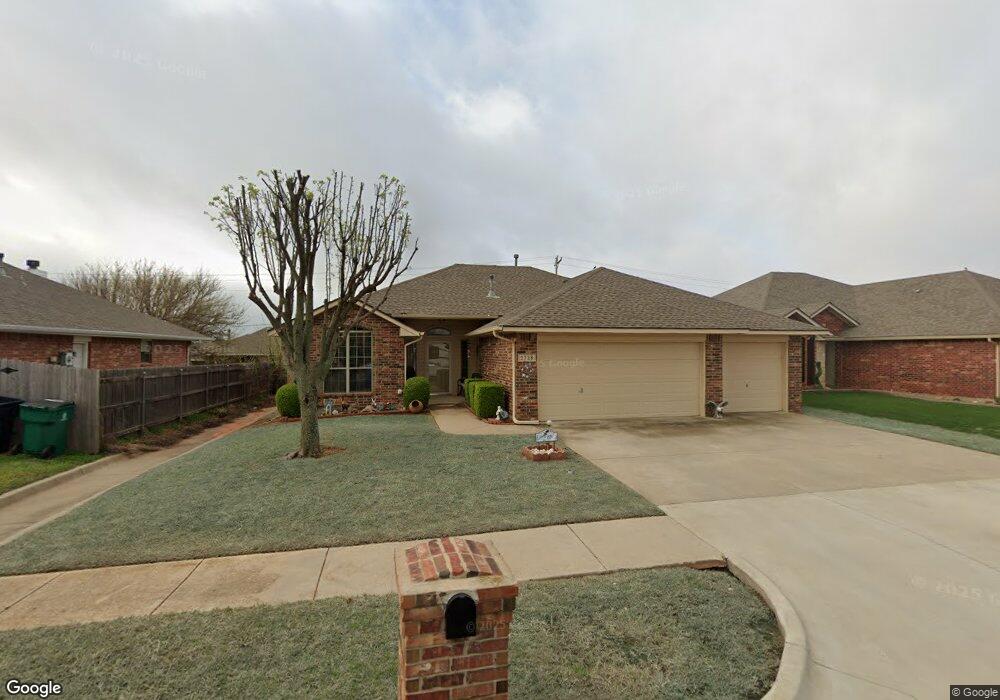
2728 SE 97th St Moore, OK 73160
Bryant NeighborhoodEstimated Value: $237,375 - $257,000
3
Beds
2
Baths
1,609
Sq Ft
$155/Sq Ft
Est. Value
About This Home
This home is located at 2728 SE 97th St, Moore, OK 73160 and is currently estimated at $249,844, approximately $155 per square foot. 2728 SE 97th St is a home located in Cleveland County with nearby schools including Bryant Elementary School, Central Junior High School, and Moore High School.
Ownership History
Date
Name
Owned For
Owner Type
Purchase Details
Closed on
Apr 25, 2019
Sold by
Storbeck Derrek John
Bought by
Winfield Properties Llc
Current Estimated Value
Purchase Details
Closed on
Jan 9, 2008
Sold by
Laverdi Ken and Laverdi Billie
Bought by
Storbeck Derek J
Home Financials for this Owner
Home Financials are based on the most recent Mortgage that was taken out on this home.
Original Mortgage
$110,950
Interest Rate
5.94%
Mortgage Type
Purchase Money Mortgage
Purchase Details
Closed on
Apr 29, 2005
Sold by
Porter Matthew V and Porter Megan M
Bought by
Laverdl Ken and Laverdl Billie
Home Financials for this Owner
Home Financials are based on the most recent Mortgage that was taken out on this home.
Original Mortgage
$25,250
Interest Rate
5.92%
Mortgage Type
Unknown
Purchase Details
Closed on
May 16, 2003
Sold by
Marical, Cliff Homes Inc
Bought by
Porter Matthew and Porter Megan M
Purchase Details
Closed on
Nov 13, 2002
Sold by
Thompson, R Development Co
Bought by
Marical, Cliff Homes Inc
Create a Home Valuation Report for This Property
The Home Valuation Report is an in-depth analysis detailing your home's value as well as a comparison with similar homes in the area
Home Values in the Area
Average Home Value in this Area
Purchase History
| Date | Buyer | Sale Price | Title Company |
|---|---|---|---|
| Winfield Properties Llc | -- | None Available | |
| Storbeck Derek J | $139,000 | Fa | |
| Laverdl Ken | $128,500 | None Available | |
| Porter Matthew | $119,000 | -- | |
| Marical, Cliff Homes Inc | $14,500 | -- |
Source: Public Records
Mortgage History
| Date | Status | Borrower | Loan Amount |
|---|---|---|---|
| Previous Owner | Storbeck Derek J | $110,950 | |
| Previous Owner | Laverdl Ken | $25,250 | |
| Previous Owner | Laverdl Ken | $102,800 |
Source: Public Records
Tax History Compared to Growth
Tax History
| Year | Tax Paid | Tax Assessment Tax Assessment Total Assessment is a certain percentage of the fair market value that is determined by local assessors to be the total taxable value of land and additions on the property. | Land | Improvement |
|---|---|---|---|---|
| 2024 | $2,755 | $22,639 | $3,658 | $18,981 |
| 2023 | $2,635 | $21,561 | $3,531 | $18,030 |
| 2022 | $2,543 | $20,535 | $3,695 | $16,840 |
| 2021 | $2,416 | $19,557 | $4,200 | $15,357 |
| 2020 | $2,368 | $19,083 | $4,152 | $14,931 |
| 2019 | $2,280 | $18,174 | $2,946 | $15,228 |
| 2018 | $2,196 | $17,310 | $3,000 | $14,310 |
| 2017 | $2,198 | $17,310 | $0 | $0 |
| 2016 | $2,221 | $17,310 | $3,000 | $14,310 |
| 2015 | $1,997 | $16,834 | $3,000 | $13,834 |
| 2014 | $1,938 | $16,067 | $2,100 | $13,967 |
Source: Public Records
Map
Nearby Homes
- 2809 SE 95th St
- 1808 NE 32nd St
- 3505 Erie Dr
- 2716 SE 92nd Cir
- 3001 SE 95th St
- 1624 NE 32nd St
- 1500 NE 33rd Terrace
- 2508 SE 92nd Terrace
- 9628 Gabriel Dr
- 3440 Lakeside Dr
- 9108 Blackfork Ln
- 9104 Blackfork Ln
- 9100 Blackfork Ln
- 9020 Blackfork Ln
- 9016 Blackfork Ln
- 1025 NE 32nd St
- 9613 Eli Dr
- 9017 Blackfork Ln
- 1001 NE 34th Terrace
- 9013 Blackfork Ln
- 2732 SE 97th St
- 2720 SE 97th St
- 2725 SE 97th St
- 2800 SE 97th St
- 2729 SE 97th St
- 1717 NE 34th St
- 1713 NE 34th St
- 2721 SE 97th St
- 1801 NE 34th St
- 2716 SE 97th St
- 1709 NE 34th St
- 2804 SE 97th St
- 1805 NE 34th St
- 2717 SE 97th St
- 2801 SE 97th St
- 1705 NE 34th St
- 2712 SE 97th St
- 2713 SE 97th St
- 2808 SE 97th St
- 1809 NE 34th St