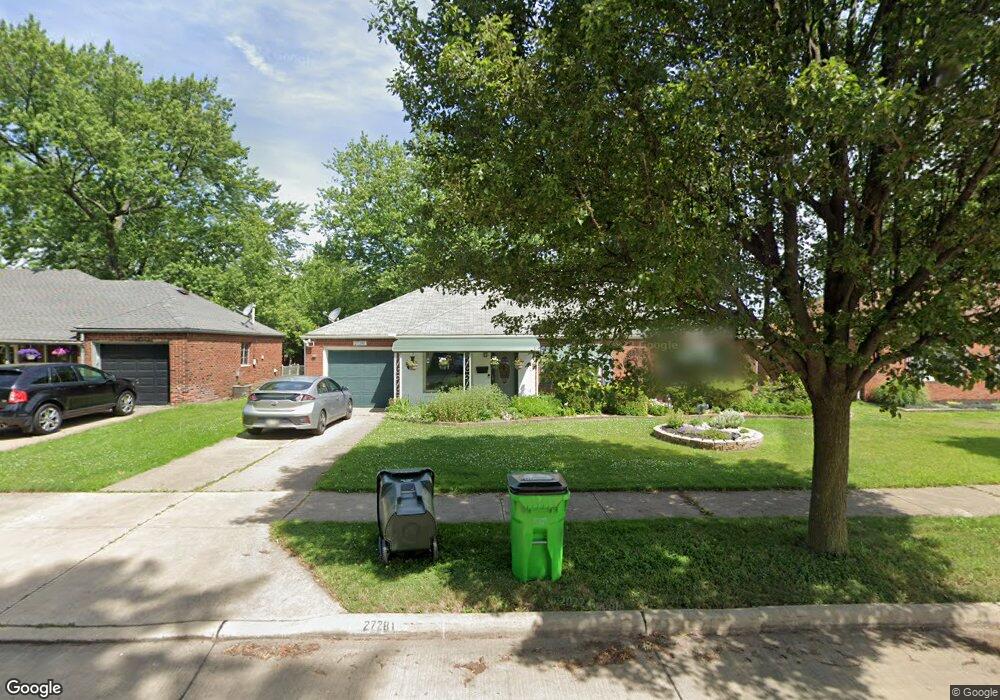
27281 Markbarry Ave Euclid, OH 44132
Estimated Value: $170,385 - $206,000
3
Beds
2
Baths
1,716
Sq Ft
$108/Sq Ft
Est. Value
About This Home
This home is located at 27281 Markbarry Ave, Euclid, OH 44132 and is currently estimated at $185,846, approximately $108 per square foot. 27281 Markbarry Ave is a home located in Cuyahoga County with nearby schools including Shoreview Elementary School, Euclid High School, and Ss. Robert & William Catholic School.
Ownership History
Date
Name
Owned For
Owner Type
Purchase Details
Closed on
Jun 25, 2009
Sold by
Cable Yvonne M
Bought by
Jones Sandra Lyn and Jones Kevin Craig
Current Estimated Value
Purchase Details
Closed on
Dec 28, 2004
Sold by
Cable Yvonne M
Bought by
Cable Yvonne M
Home Financials for this Owner
Home Financials are based on the most recent Mortgage that was taken out on this home.
Original Mortgage
$180,000
Interest Rate
4.16%
Mortgage Type
New Conventional
Purchase Details
Closed on
Mar 3, 1992
Sold by
Cable C Robert
Bought by
Cable Charles R and Cable Yvonne M
Purchase Details
Closed on
Aug 9, 1977
Sold by
Cable Cable C and Cable Yvonne M
Bought by
Cable C Robert
Purchase Details
Closed on
Jan 1, 1975
Bought by
Cable Cable C and Cable Yvonne M
Create a Home Valuation Report for This Property
The Home Valuation Report is an in-depth analysis detailing your home's value as well as a comparison with similar homes in the area
Home Values in the Area
Average Home Value in this Area
Purchase History
| Date | Buyer | Sale Price | Title Company |
|---|---|---|---|
| Jones Sandra Lyn | -- | None Available | |
| Cable Yvonne M | -- | Vanguard Title Agency Llc | |
| Cable Charles R | -- | -- | |
| Cable C Robert | -- | -- | |
| Cable Cable C | -- | -- |
Source: Public Records
Mortgage History
| Date | Status | Borrower | Loan Amount |
|---|---|---|---|
| Previous Owner | Cable Yvonne M | $180,000 | |
| Closed | Cable Yvonne M | $180,000 |
Source: Public Records
Tax History Compared to Growth
Tax History
| Year | Tax Paid | Tax Assessment Tax Assessment Total Assessment is a certain percentage of the fair market value that is determined by local assessors to be the total taxable value of land and additions on the property. | Land | Improvement |
|---|---|---|---|---|
| 2024 | $3,172 | $55,615 | $9,660 | $45,955 |
| 2023 | $2,958 | $43,230 | $8,540 | $34,690 |
| 2022 | $2,924 | $43,230 | $8,540 | $34,690 |
| 2021 | $3,247 | $43,230 | $8,540 | $34,690 |
| 2020 | $2,524 | $32,760 | $6,480 | $26,290 |
| 2019 | $2,269 | $93,600 | $18,500 | $75,100 |
| 2018 | $2,289 | $32,760 | $6,480 | $26,290 |
| 2017 | $2,308 | $28,950 | $5,180 | $23,770 |
| 2016 | $2,313 | $28,250 | $5,180 | $23,070 |
| 2015 | $2,040 | $28,250 | $5,180 | $23,070 |
| 2014 | $2,040 | $28,250 | $5,180 | $23,070 |
Source: Public Records
Map
Nearby Homes
- 461 E 271st St
- 559 Sycamore Dr
- 440 E 271st St
- 577 Sycamore Dr
- 27190 Shoreview Ave
- 546 Walnut Dr
- 445 E 275th St
- 27101 Zeman Ave
- 415 E 266th St
- 369 E 270th St
- 625 Lloyd Rd
- 29038 Fuller Ave
- 26471 Shoreview Ave
- 459 Lloyd Rd
- 405 E 262nd St
- 355 E 262nd St
- 26471 Farringdon Ave
- 26230 Oriole Ave
- 712 E 266th St
- 26171 Shoreview Ave
- 27291 Markbarry Ave
- 27261 Markbarry Ave
- 27280 Forestview Ave
- 27290 Forestview Ave
- 27301 Markbarry Ave
- 27260 Forestview Ave
- 27251 Markbarry Ave
- 27300 Forestview Ave
- 27280 Markbarry Dr
- 27260 Markbarry Ave
- 27240 Forestview Ave
- 27290 Markbarry Ave
- 27321 Markbarry Ave
- 27320 Forestview Ave
- 27241 Markbarry Ave
- 27300 Markbarry Ave
- 27230 Forestview Ave
- 27331 Markbarry Ave
- 27230 Markbarry Ave
- 27320 Markbarry Ave