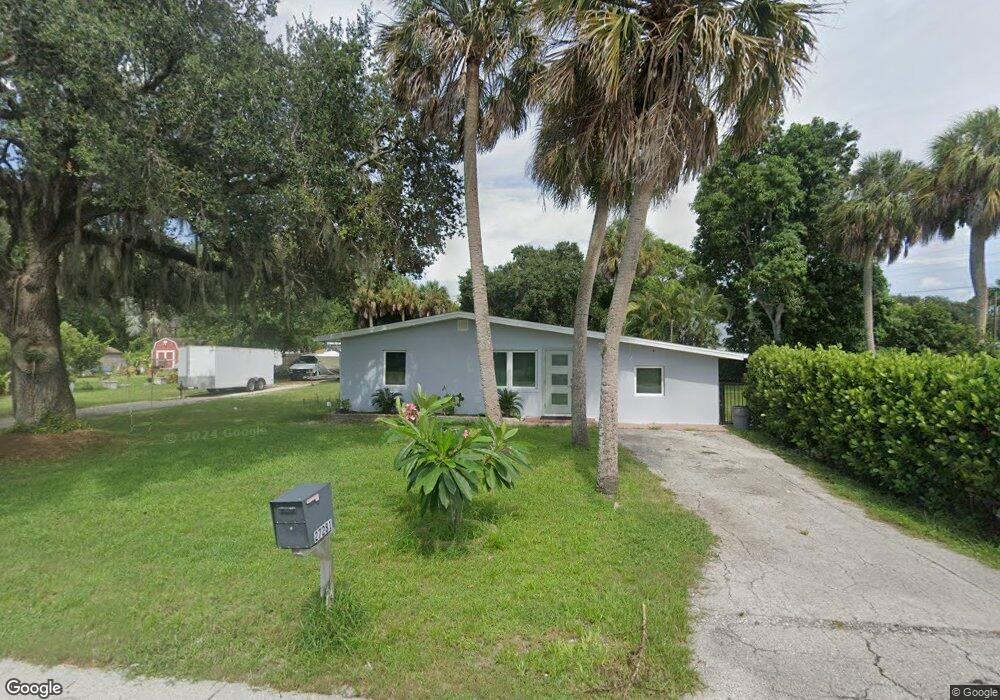
27281 Shriver Ave Bonita Springs, FL 34135
Downtown Bonita Springs NeighborhoodEstimated Value: $287,000 - $350,000
3
Beds
2
Baths
1,136
Sq Ft
$272/Sq Ft
Est. Value
About This Home
This home is located at 27281 Shriver Ave, Bonita Springs, FL 34135 and is currently estimated at $309,459, approximately $272 per square foot. 27281 Shriver Ave is a home located in Lee County with nearby schools including Bonita Springs Elementary School, Spring Creek Elementary School, and Pinewoods Elementary School.
Ownership History
Date
Name
Owned For
Owner Type
Purchase Details
Closed on
May 3, 2016
Sold by
Roop Jack C and Bourdon Micheal A
Bought by
Bauer Egle
Current Estimated Value
Home Financials for this Owner
Home Financials are based on the most recent Mortgage that was taken out on this home.
Original Mortgage
$152,000
Outstanding Balance
$121,199
Interest Rate
3.71%
Mortgage Type
New Conventional
Estimated Equity
$188,260
Purchase Details
Closed on
Jan 12, 2011
Sold by
Citimortgage Inc
Bought by
Roop Jack C and Bourdon Michele A
Purchase Details
Closed on
Oct 19, 2010
Sold by
Federal Home Loan Mortgage Corporation
Bought by
Citimortgage Inc
Purchase Details
Closed on
Aug 13, 2010
Sold by
Gilley James K
Bought by
Roop Jack C and Bourdon Michele A
Purchase Details
Closed on
Jul 20, 2010
Sold by
Gilley James K
Bought by
Federal Home Loan Mortgage Corp
Purchase Details
Closed on
Oct 6, 2000
Sold by
Hillyer Larry L and Hillyer Barbara
Bought by
Ellis William and Ellis Maureen
Create a Home Valuation Report for This Property
The Home Valuation Report is an in-depth analysis detailing your home's value as well as a comparison with similar homes in the area
Home Values in the Area
Average Home Value in this Area
Purchase History
| Date | Buyer | Sale Price | Title Company |
|---|---|---|---|
| Bauer Egle | $162,000 | Tropical Title | |
| Roop Jack C | $41,900 | Action Title Company | |
| Citimortgage Inc | -- | Action Title Company | |
| Roop Jack C | $40,500 | Tropical Title | |
| Federal Home Loan Mortgage Corp | -- | None Available | |
| Ellis William | $71,000 | -- |
Source: Public Records
Mortgage History
| Date | Status | Borrower | Loan Amount |
|---|---|---|---|
| Open | Bauer Egle | $152,000 |
Source: Public Records
Tax History Compared to Growth
Tax History
| Year | Tax Paid | Tax Assessment Tax Assessment Total Assessment is a certain percentage of the fair market value that is determined by local assessors to be the total taxable value of land and additions on the property. | Land | Improvement |
|---|---|---|---|---|
| 2025 | $3,046 | $199,431 | -- | -- |
| 2024 | $2,807 | $181,301 | -- | -- |
| 2023 | $2,807 | $164,819 | $0 | $0 |
| 2022 | $2,405 | $147,071 | $0 | $0 |
| 2021 | $2,126 | $133,701 | $43,725 | $89,976 |
| 2020 | $2,101 | $134,854 | $23,850 | $111,004 |
| 2019 | $1,877 | $112,242 | $23,850 | $88,392 |
| 2018 | $1,876 | $113,052 | $23,850 | $89,202 |
| 2017 | $1,807 | $105,784 | $16,165 | $89,619 |
| 2016 | $1,428 | $96,068 | $16,165 | $79,903 |
| 2015 | $1,329 | $85,601 | $16,165 | $69,436 |
| 2014 | $1,240 | $80,501 | $16,430 | $64,071 |
| 2013 | -- | $49,900 | $16,430 | $33,470 |
Source: Public Records
Map
Nearby Homes
- 10680 Goodwin St
- 10810 Goodwin St
- 27075 Orange Court Dr
- 27261 Dortch Ave
- 27251 Elwood Dr
- 27551 Shriver Ave
- 27281 S Riverside Dr
- 10320 River Dr
- 27091 Matheson Ave Unit 105
- 27311 S Riverside Dr
- 27101 Pine Ave
- 10632 Woods Cir Unit 1
- 27111 Matheson Ave Unit 103
- 26900 N Riverside Dr
- 26791 N Riverside Dr
- 27103 Matheson Ave Unit 201
- 27079 Matheson Ave Unit 108
- 27240 River Royale Ct
- 27277/281 Shriver Ave
- 27270 Shriver Ave
- 27281/2729 Shriver Ave
- 27271 Shriver Ave
- 27251 Shriver Ave
- 27280 Pullen Ave
- 10699 Wilson St
- 27260 Pullen Ave
- 10651/653 Wilson St
- 10660 Wilson St Unit 700
- 10650 Wilson St
- 27260 Shriver Ave
- 27324 Shriver Ave
- 10641 Wilson St
- 27250 Shriver Ave Unit ID1073511P
- 27250 Shriver Ave Unit FL1-ID1073506P
- 27250 Shriver Ave Unit FL1-ID1073504P
- 27250 Shriver Ave Unit FL1-ID1073508P
- 27250 Shriver Ave
- 27312 Pauline Dr