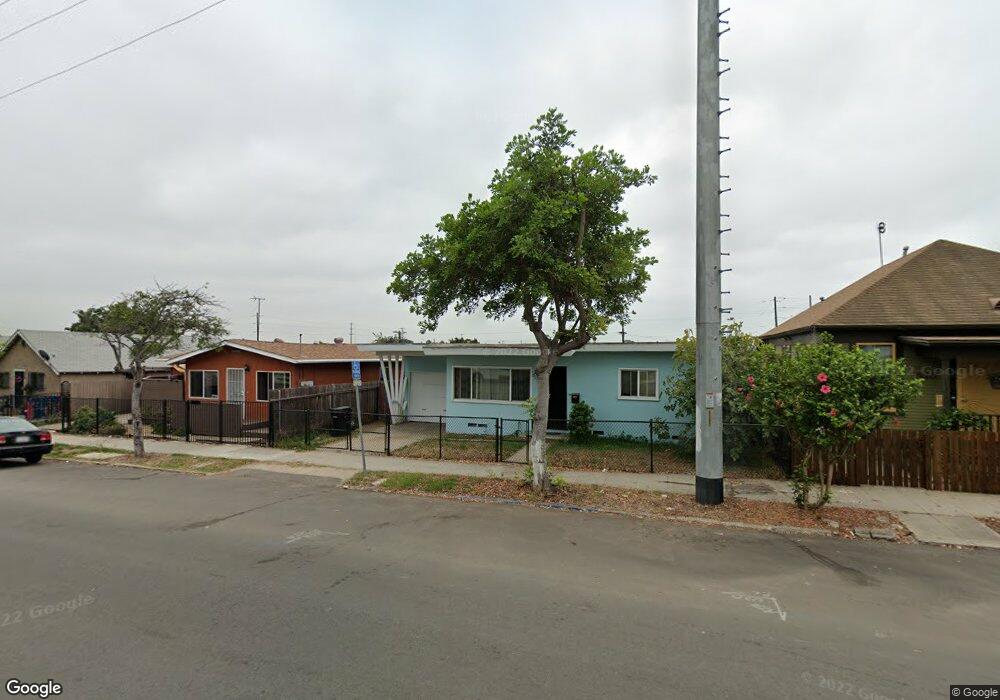
2729 K St San Diego, CA 92102
Grant Hill NeighborhoodEstimated Value: $665,705 - $680,000
3
Beds
1
Bath
810
Sq Ft
$831/Sq Ft
Est. Value
About This Home
This home is located at 2729 K St, San Diego, CA 92102 and is currently estimated at $672,926, approximately $830 per square foot. 2729 K St is a home located in San Diego County with nearby schools including Kimbrough Elementary School, Logan Memorial Educational Campus, and Albert Einstein Academy Charter Middle.
Ownership History
Date
Name
Owned For
Owner Type
Purchase Details
Closed on
Jul 6, 2017
Sold by
Johnson Jill M and Lillian Johnson Living Trust
Bought by
Johnson Betty
Current Estimated Value
Home Financials for this Owner
Home Financials are based on the most recent Mortgage that was taken out on this home.
Original Mortgage
$267,200
Outstanding Balance
$222,424
Interest Rate
3.96%
Mortgage Type
New Conventional
Estimated Equity
$450,502
Purchase Details
Closed on
Apr 21, 2006
Sold by
Johnson Lillian
Bought by
Johnson Lillian
Purchase Details
Closed on
Aug 19, 1999
Sold by
Quayle Johnson
Bought by
Johnson Quayle and Johnson Lillian
Home Financials for this Owner
Home Financials are based on the most recent Mortgage that was taken out on this home.
Original Mortgage
$58,500
Interest Rate
7.56%
Mortgage Type
Purchase Money Mortgage
Purchase Details
Closed on
Sep 17, 1998
Sold by
Quayle Johnson
Bought by
The Lillian Johnson Living Trust
Create a Home Valuation Report for This Property
The Home Valuation Report is an in-depth analysis detailing your home's value as well as a comparison with similar homes in the area
Home Values in the Area
Average Home Value in this Area
Purchase History
| Date | Buyer | Sale Price | Title Company |
|---|---|---|---|
| Johnson Betty | $334,000 | Lawyers Title Company | |
| Johnson Lillian | -- | None Available | |
| Johnson Quayle | -- | First American Title Ins Co | |
| The Lillian Johnson Living Trust | -- | -- |
Source: Public Records
Mortgage History
| Date | Status | Borrower | Loan Amount |
|---|---|---|---|
| Open | Johnson Betty | $267,200 | |
| Closed | Johnson Quayle | $58,500 |
Source: Public Records
Tax History Compared to Growth
Tax History
| Year | Tax Paid | Tax Assessment Tax Assessment Total Assessment is a certain percentage of the fair market value that is determined by local assessors to be the total taxable value of land and additions on the property. | Land | Improvement |
|---|---|---|---|---|
| 2025 | $402 | $30,425 | $13,363 | $17,062 |
| 2024 | $402 | $29,829 | $13,101 | $16,728 |
| 2023 | $392 | $29,245 | $12,845 | $16,400 |
| 2022 | $382 | $28,673 | $12,594 | $16,079 |
| 2021 | $379 | $28,112 | $12,348 | $15,764 |
| 2020 | $375 | $27,825 | $12,222 | $15,603 |
| 2019 | $369 | $27,281 | $11,983 | $15,298 |
| 2018 | $347 | $26,748 | $11,749 | $14,999 |
| 2017 | $338 | $26,224 | $11,519 | $14,705 |
| 2016 | $249 | $25,711 | $11,294 | $14,417 |
| 2015 | $245 | $25,326 | $11,125 | $14,201 |
| 2014 | $241 | $24,831 | $10,908 | $13,923 |
Source: Public Records
Map
Nearby Homes
- 2680 L St
- 2832 K St
- 2701-11 Imperial Ave
- 244 26th St
- 2567-69 L St
- 2942 N L St
- 0 J St Unit NDP2509260
- 325 Dewey St
- 2547 Commercial St
- 2946 Commercial St
- 918-32 27th St
- 918-32 27th St Unit 918-32
- 2971/2971 1/2 Imperial Ave
- 2451-53 Island Ave
- 3035 L St
- 1990 Harrison Ave
- 3043 Market St
- 2057-59 Harrison Ave
- 2948 Franklin Ave
- 2185 Harrison Ave