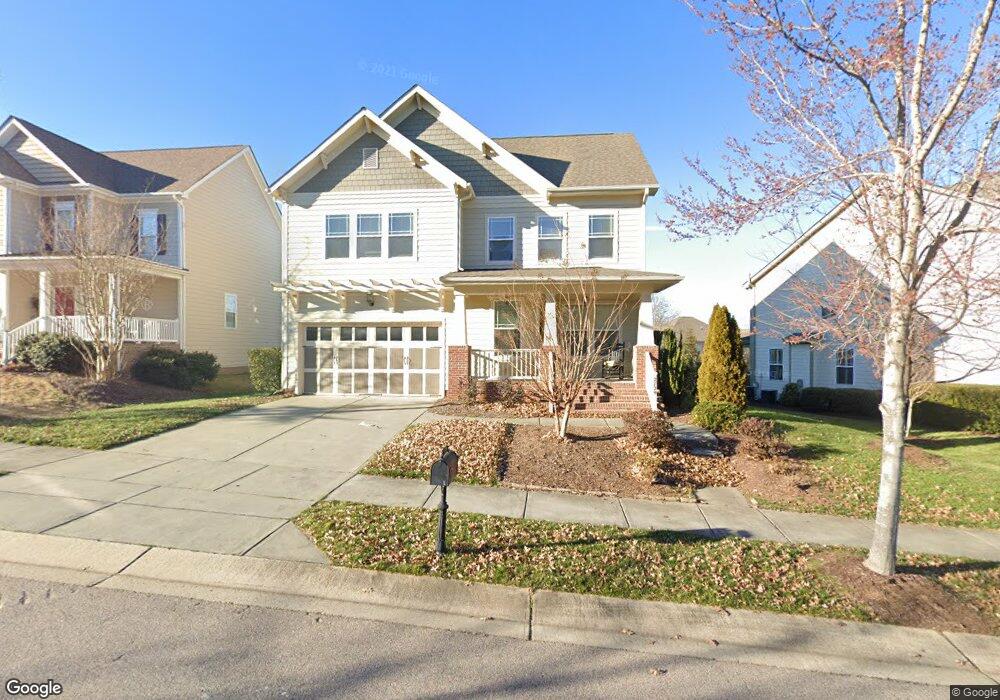
2729 Royal Forrest Dr Unit L1923 Raleigh, NC 27614
Bedford at Falls River NeighborhoodEstimated Value: $527,522 - $677,000
3
Beds
3
Baths
2,206
Sq Ft
$277/Sq Ft
Est. Value
About This Home
This home is located at 2729 Royal Forrest Dr Unit L1923, Raleigh, NC 27614 and is currently estimated at $610,131, approximately $276 per square foot. 2729 Royal Forrest Dr Unit L1923 is a home located in Wake County with nearby schools including Abbotts Creek Elementary School, Wakefield Middle, and Wakefield High School.
Ownership History
Date
Name
Owned For
Owner Type
Purchase Details
Closed on
May 1, 2012
Sold by
Salter Tanya Chaplinsky and Chaplinsky Tanya D
Bought by
Salter Tanya Chaplinsky and Salter Michael Rolando
Current Estimated Value
Home Financials for this Owner
Home Financials are based on the most recent Mortgage that was taken out on this home.
Original Mortgage
$268,500
Outstanding Balance
$36,881
Interest Rate
3.34%
Mortgage Type
New Conventional
Estimated Equity
$573,250
Purchase Details
Closed on
Jul 30, 2010
Sold by
Brandywine L L C
Bought by
Chaplinsky Tanya D
Home Financials for this Owner
Home Financials are based on the most recent Mortgage that was taken out on this home.
Original Mortgage
$273,900
Interest Rate
4.74%
Mortgage Type
New Conventional
Create a Home Valuation Report for This Property
The Home Valuation Report is an in-depth analysis detailing your home's value as well as a comparison with similar homes in the area
Home Values in the Area
Average Home Value in this Area
Purchase History
| Date | Buyer | Sale Price | Title Company |
|---|---|---|---|
| Salter Tanya Chaplinsky | -- | None Available | |
| Chaplinsky Tanya D | $288,500 | None Available |
Source: Public Records
Mortgage History
| Date | Status | Borrower | Loan Amount |
|---|---|---|---|
| Open | Salter Tanya Chaplinsky | $268,500 | |
| Closed | Chaplinsky Tanya D | $273,900 |
Source: Public Records
Tax History Compared to Growth
Tax History
| Year | Tax Paid | Tax Assessment Tax Assessment Total Assessment is a certain percentage of the fair market value that is determined by local assessors to be the total taxable value of land and additions on the property. | Land | Improvement |
|---|---|---|---|---|
| 2025 | $4,591 | $524,087 | $115,000 | $409,087 |
| 2024 | $4,572 | $524,087 | $115,000 | $409,087 |
| 2023 | $3,976 | $362,894 | $90,000 | $272,894 |
| 2022 | $3,694 | $362,894 | $90,000 | $272,894 |
| 2021 | $3,551 | $362,894 | $90,000 | $272,894 |
| 2020 | $3,486 | $362,894 | $90,000 | $272,894 |
| 2019 | $4,151 | $356,421 | $100,000 | $256,421 |
| 2018 | $3,914 | $356,421 | $100,000 | $256,421 |
| 2017 | $3,728 | $356,421 | $100,000 | $256,421 |
| 2016 | $3,651 | $356,421 | $100,000 | $256,421 |
| 2015 | $3,718 | $357,098 | $92,000 | $265,098 |
| 2014 | $3,526 | $357,098 | $92,000 | $265,098 |
Source: Public Records
Map
Nearby Homes
- 10701 Royal Forrest Dr
- 3821 Falls River Ave
- 3606 Silver Forrest Ln
- 2419 Rogerson St
- 2822 Winter Song Rd
- 2201 Wide River Dr
- 2202 Spacious Skies St
- 10507 Bedfordtown Dr
- 2201 Karns Place
- 2231 Cloud Cover
- 2704 Snowy Meadow Ct
- 4113 Falls River Ave
- 2200 Caramoor Ln
- 2728 Cloud Mist Cir
- 2740 Cloud Mist Cir
- 2061 Hopeton Ave
- 11721 Wake Bluff Dr
- 10603 Friendly Neighbor Ln
- 10638 Cardington Ln
- 3436 Falls River Ave
- 2729 Royal Forrest Dr
- 2725 Royal Forrest Dr
- 2739 Royal Forrest Dr
- 2739 Royal Forrest Dr Unit L1922
- 2728 Royal Forrest Dr
- 2738 Hidden Waters Cir
- 2738 Hidden Waters Cir Unit L1916
- 2745 Royal Forrest Dr
- 2745 Royal Forrest Dr Unit L1921
- 2742 Hidden Waters Cir
- 2742 Hidden Waters Cir Unit L1917
- 2732 Royal Forrest Dr
- 2732 Royal Forrest Dr Unit L1898
- 2724 Royal Forrest Dr
- 2721 Royal Forrest Dr
- 2734 Hidden Waters Cir Unit L1915
- 2736 Royal Forrest Dr
- 2736 Royal Forrest Dr Unit L1897
- 2749 Royal Forrest Dr
- 2749 Royal Forrest Dr Unit L1920