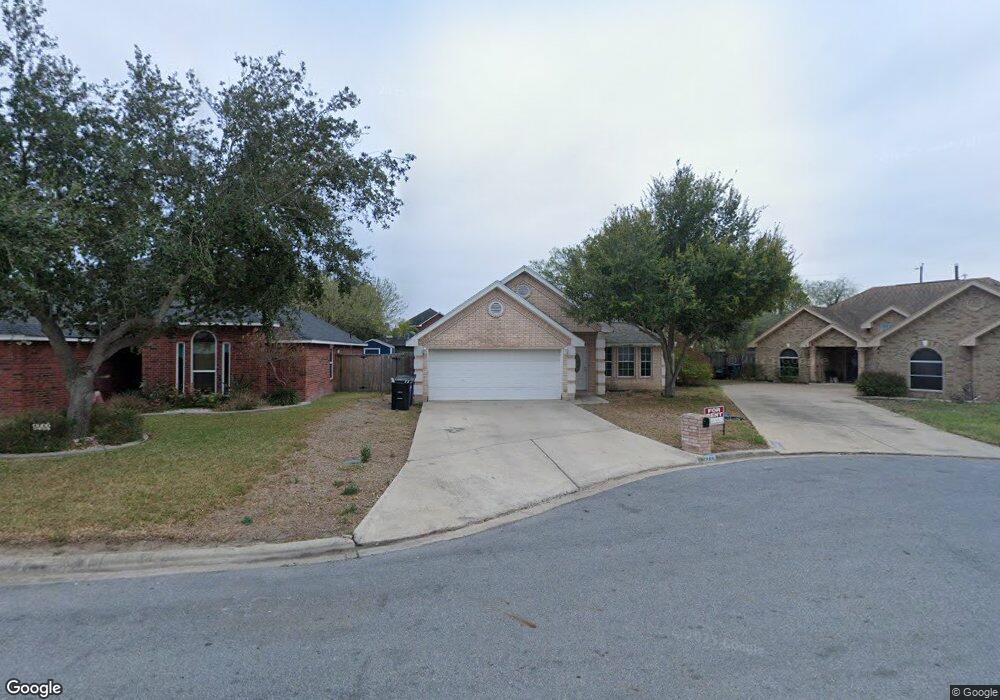
2729 Toucan Ave McAllen, TX 78504
Estimated Value: $223,000 - $287,000
3
Beds
2
Baths
1,672
Sq Ft
$148/Sq Ft
Est. Value
About This Home
This home is located at 2729 Toucan Ave, McAllen, TX 78504 and is currently estimated at $247,213, approximately $147 per square foot. 2729 Toucan Ave is a home located in Hidalgo County with nearby schools including Garza Elementary School, Michael E. Fossum Middle School, and Rowe High School.
Ownership History
Date
Name
Owned For
Owner Type
Purchase Details
Closed on
May 9, 2018
Sold by
Perez Fermin Hawk
Bought by
Perez Margaret
Current Estimated Value
Purchase Details
Closed on
Mar 2, 2018
Sold by
County Of Hidalgo
Bought by
Perez Fermin Hawk
Purchase Details
Closed on
Dec 7, 2010
Sold by
Novellini Ltd
Bought by
Garcia Alejandro R
Home Financials for this Owner
Home Financials are based on the most recent Mortgage that was taken out on this home.
Original Mortgage
$150,000
Interest Rate
4.24%
Mortgage Type
Purchase Money Mortgage
Purchase Details
Closed on
May 16, 1997
Sold by
K & N Homes Llc
Bought by
Rodriguez Rosalinda
Home Financials for this Owner
Home Financials are based on the most recent Mortgage that was taken out on this home.
Original Mortgage
$78,105
Interest Rate
7.85%
Mortgage Type
Seller Take Back
Create a Home Valuation Report for This Property
The Home Valuation Report is an in-depth analysis detailing your home's value as well as a comparison with similar homes in the area
Home Values in the Area
Average Home Value in this Area
Purchase History
| Date | Buyer | Sale Price | Title Company |
|---|---|---|---|
| Perez Margaret | -- | None Available | |
| Perez Fermin Hawk | $87,000 | None Available | |
| Garcia Alejandro R | -- | None Available | |
| Rodriguez Rosalinda | -- | -- |
Source: Public Records
Mortgage History
| Date | Status | Borrower | Loan Amount |
|---|---|---|---|
| Previous Owner | Garcia Alejandro R | $150,000 | |
| Previous Owner | Rodriguez Rosalinda | $78,105 |
Source: Public Records
Tax History Compared to Growth
Tax History
| Year | Tax Paid | Tax Assessment Tax Assessment Total Assessment is a certain percentage of the fair market value that is determined by local assessors to be the total taxable value of land and additions on the property. | Land | Improvement |
|---|---|---|---|---|
| 2025 | $4,444 | $238,480 | $75,201 | $163,279 |
| 2024 | $4,444 | $188,888 | $38,407 | $150,481 |
| 2023 | $4,487 | $190,722 | $38,407 | $152,315 |
| 2022 | $4,348 | $175,311 | $38,407 | $136,904 |
| 2021 | $3,763 | $147,303 | $38,407 | $108,896 |
| 2020 | $3,203 | $125,539 | $38,407 | $87,132 |
| 2019 | $3,025 | $119,240 | $38,407 | $80,833 |
| 2018 | $2,900 | $114,158 | $32,275 | $81,883 |
| 2017 | $2,938 | $115,208 | $32,275 | $82,933 |
| 2016 | $2,965 | $116,257 | $32,275 | $83,982 |
| 2015 | $2,711 | $117,307 | $32,275 | $85,032 |
Source: Public Records
Map
Nearby Homes
- 7200 N 28th Ln
- 2604 Toucan Ave
- 2809 Verdin Ave
- 3100 Umar Ave
- 10345 N 31st St
- 10419 N 32nd Ln
- 7400 N 33rd St
- 7213 N 33rd St Unit 2
- 7413 N 33rd St
- 5704 Oriole Ave
- 7620 N 27th St
- 6700 N 26th St
- 3212 Oriole Ave
- 6507 N 26th Ln
- 2901 Mynah Ave
- 7716 N 26th St
- 3404 Yellowhammer Ave
- 14616 Aqualina Way
- 6800 N 35th St
- 7809 N 27th St
- 2725 Toucan Ave
- 2733 Toucan Ave
- 7201 N 28th St
- 7201 N 28th Ln
- 2721 Toucan Ave
- 7118 N 29th St
- 7205 N 28th Ln
- 2804 Thunderbird Ave
- 2808 Thunderbird Ave
- 7200 N 28th St
- 2717 Toucan Ave
- 2800 Thunderbird Ave
- 7209 N 28th St
- 7209 N 28th Ln
- 2812 Thunderbird Ave
- 2712 Thunderbird Ave
- 7204 N 28th Ln
- 2713 Toucan Ave
- 2816 Thunderbird Ave
- 2716 Toucan Ave