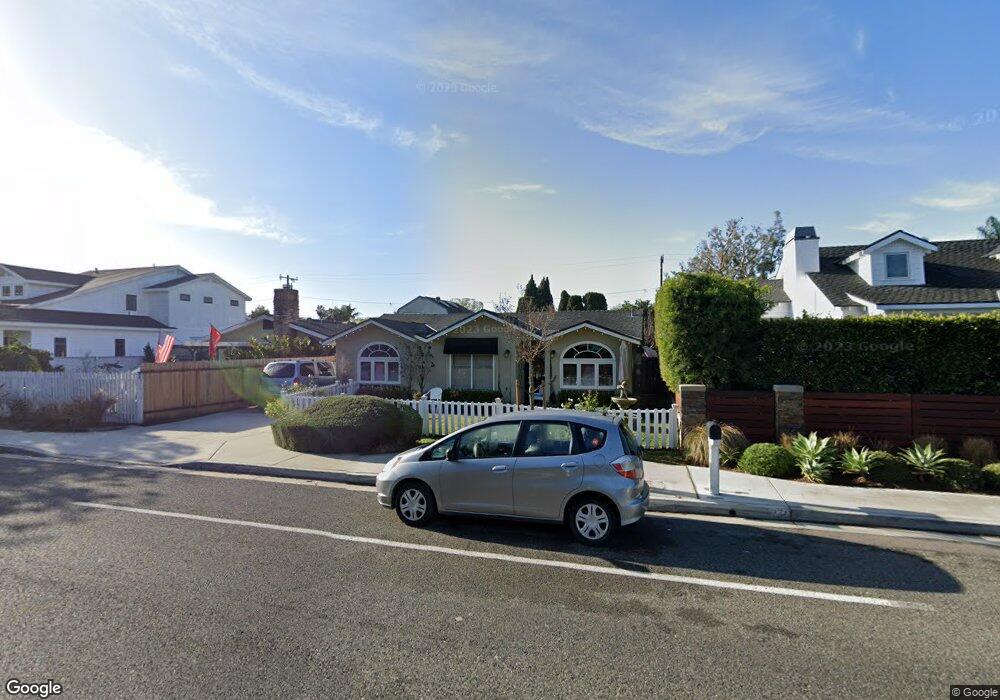
273 E 19th St Costa Mesa, CA 92627
Downtown Costa Mesa NeighborhoodEstimated Value: $1,634,000 - $2,353,000
4
Beds
2
Baths
1,548
Sq Ft
$1,233/Sq Ft
Est. Value
About This Home
This home is located at 273 E 19th St, Costa Mesa, CA 92627 and is currently estimated at $1,909,457, approximately $1,233 per square foot. 273 E 19th St is a home located in Orange County with nearby schools including Heinz Kaiser Elementary School, Woodland Elementary School, and Horace Ensign Intermediate School.
Ownership History
Date
Name
Owned For
Owner Type
Purchase Details
Closed on
Aug 16, 2023
Sold by
Lipps Judith F
Bought by
273 E 19Th St A & B Cm Ca Llc
Current Estimated Value
Purchase Details
Closed on
Aug 23, 2018
Sold by
Lipps Ben J
Bought by
Lipps Judith F
Purchase Details
Closed on
Aug 17, 2018
Sold by
Leeper Charles and Leeper Janet
Bought by
Lipps Judith F
Purchase Details
Closed on
Sep 28, 2009
Sold by
Leeper Charles and Leeper Janet
Bought by
Leeper Charles and Leeper Janet
Purchase Details
Closed on
Mar 18, 2008
Sold by
Wagner Walter
Bought by
Leeper Charles and Leeper Janet
Home Financials for this Owner
Home Financials are based on the most recent Mortgage that was taken out on this home.
Original Mortgage
$723,644
Interest Rate
6.04%
Mortgage Type
FHA
Purchase Details
Closed on
May 19, 1997
Sold by
Arnold Frederick W
Bought by
Iltis Barbara
Create a Home Valuation Report for This Property
The Home Valuation Report is an in-depth analysis detailing your home's value as well as a comparison with similar homes in the area
Home Values in the Area
Average Home Value in this Area
Purchase History
| Date | Buyer | Sale Price | Title Company |
|---|---|---|---|
| 273 E 19Th St A & B Cm Ca Llc | $1,300,000 | Chicago Title Company | |
| Lipps Judith F | -- | Wfg National Title Ins Co | |
| Lipps Judith F | $1,299,000 | Wfg National Title Ins Co | |
| Leeper Charles | -- | Security Union Title Ins Co | |
| Leeper Charles | $735,000 | Orange Coast Title | |
| Iltis Barbara | $250,000 | American Title Co |
Source: Public Records
Mortgage History
| Date | Status | Borrower | Loan Amount |
|---|---|---|---|
| Previous Owner | Leeper Charles | $723,644 |
Source: Public Records
Tax History
| Year | Tax Paid | Tax Assessment Tax Assessment Total Assessment is a certain percentage of the fair market value that is determined by local assessors to be the total taxable value of land and additions on the property. | Land | Improvement |
|---|---|---|---|---|
| 2025 | $16,980 | $1,479,000 | $1,399,325 | $79,675 |
| 2024 | $16,980 | $1,450,000 | $1,371,887 | $78,113 |
| 2023 | $16,145 | $1,392,789 | $1,323,130 | $69,659 |
| 2022 | $15,669 | $1,365,480 | $1,297,186 | $68,294 |
| 2021 | $15,210 | $1,338,706 | $1,271,751 | $66,955 |
| 2020 | $15,035 | $1,324,980 | $1,258,711 | $66,269 |
| 2019 | $14,711 | $1,299,000 | $1,234,030 | $64,970 |
| 2018 | $9,873 | $848,487 | $769,166 | $79,321 |
| 2017 | $9,708 | $831,850 | $754,084 | $77,766 |
| 2016 | $9,577 | $815,540 | $739,298 | $76,242 |
| 2015 | $9,486 | $803,290 | $728,193 | $75,097 |
| 2014 | $9,273 | $787,555 | $713,929 | $73,626 |
Source: Public Records
Map
Nearby Homes
- 212 E 19th St
- 329 E 19th St
- 308 E 18th St
- 175 Costa Mesa St
- 1956 Rosemary Place
- 300 Alva Ln
- 1935 Tustin Ave
- 2019 Orange Ave
- 1741 Tustin Ave Unit 3C
- 1741 Tustin Ave Unit 5C
- 2048 Garden Ln
- 401 Bernard St Unit 211
- 401 Bernard St Unit 202
- 329 Ford Rd
- 2060 Newport Blvd
- 201 E 21st St
- 1973 Newport Blvd Unit 3
- 1973 Newport Blvd Unit 10
- 450 Cabrillo St
- 375 E 21st St
- 273 E 19th St Unit B
- 271 E 19th St
- 279 E 19th St
- 257 E 19th St
- 283 E 19th St
- 268 Flower St Unit A
- 268 Flower St Unit "B"
- 268 Flower St
- 285 E 19th St
- 255 E 19th St
- 278 Flower St
- 260 Flower St Unit A
- 260 Flower St
- 282 Flower St
- 268 E 19th St
- 274 E 19th St
- 253 E 19th St
- 291 E 19th St
- 284 Flower St
- 262 E 19th St
Your Personal Tour Guide
Ask me questions while you tour the home.