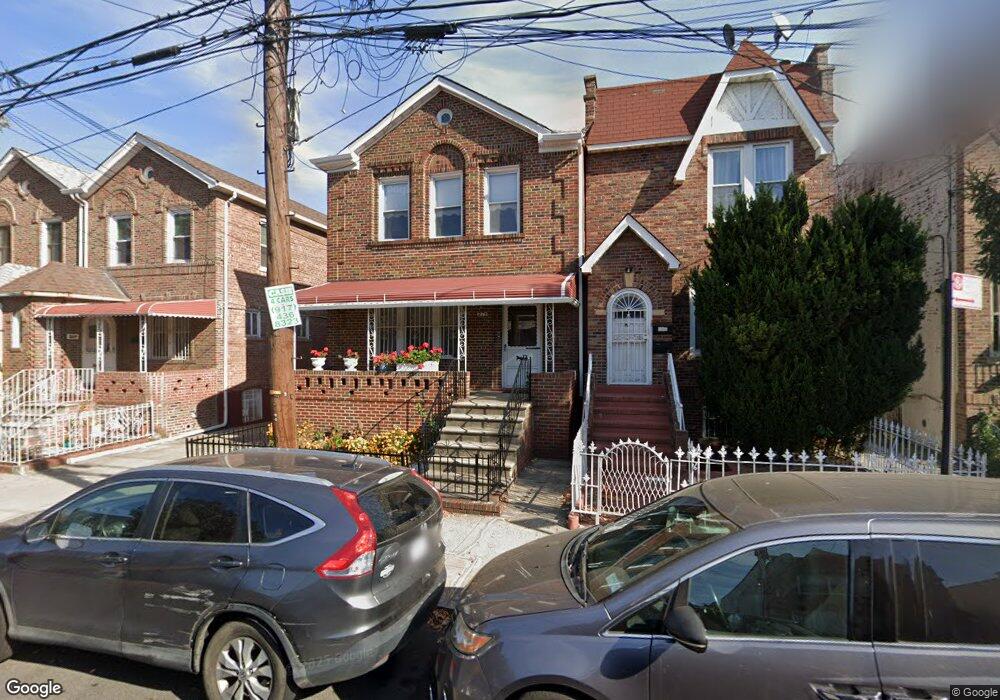
273 E 57th St Brooklyn, NY 11203
East Flatbush NeighborhoodEstimated Value: $897,000 - $968,000
Studio
--
Bath
2,596
Sq Ft
$355/Sq Ft
Est. Value
About This Home
This home is located at 273 E 57th St, Brooklyn, NY 11203 and is currently estimated at $920,690, approximately $354 per square foot. 273 E 57th St is a home located in Kings County with nearby schools including Ps 244 Richard R Green, I.S. 285 Meyer Levin, and Ivy Hill Preparatory Charter School.
Ownership History
Date
Name
Owned For
Owner Type
Purchase Details
Closed on
Sep 21, 2023
Sold by
Thomas Seymour G and Thomas Yvonne A
Bought by
Yvonne A Thomas Revocable Living Trust and Yvonne A Thomas Trustee
Current Estimated Value
Purchase Details
Closed on
Jan 12, 2006
Sold by
Crawford Leta and Crawford Martin
Bought by
Thomas Seymour G and Thomas Yvonne A
Create a Home Valuation Report for This Property
The Home Valuation Report is an in-depth analysis detailing your home's value as well as a comparison with similar homes in the area
Home Values in the Area
Average Home Value in this Area
Purchase History
| Date | Buyer | Sale Price | Title Company |
|---|---|---|---|
| Yvonne A Thomas Revocable Living Trust | -- | -- | |
| Yvonne A Thomas Revocable Living Trust | -- | -- | |
| Yvonne A Thomas Revocable Living Trust | -- | -- | |
| Thomas Seymour G | -- | -- | |
| Thomas Seymour G | -- | -- |
Source: Public Records
Mortgage History
| Date | Status | Borrower | Loan Amount |
|---|---|---|---|
| Closed | Thomas Seymour G | $0 |
Source: Public Records
Tax History
| Year | Tax Paid | Tax Assessment Tax Assessment Total Assessment is a certain percentage of the fair market value that is determined by local assessors to be the total taxable value of land and additions on the property. | Land | Improvement |
|---|---|---|---|---|
| 2025 | $7,131 | $52,980 | $20,760 | $32,220 |
| 2024 | $7,131 | $52,920 | $20,760 | $32,160 |
| 2023 | $6,786 | $62,100 | $20,760 | $41,340 |
| 2022 | $6,270 | $50,820 | $20,760 | $30,060 |
| 2021 | $6,616 | $45,540 | $20,760 | $24,780 |
| 2020 | $3,262 | $41,820 | $20,760 | $21,060 |
| 2019 | $6,140 | $41,820 | $20,760 | $21,060 |
| 2018 | $5,616 | $29,012 | $16,322 | $12,690 |
| 2017 | $5,280 | $27,370 | $15,299 | $12,071 |
| 2016 | $5,162 | $27,370 | $16,024 | $11,346 |
| 2015 | $2,895 | $27,163 | $18,364 | $8,799 |
| 2014 | $2,895 | $25,627 | $14,776 | $10,851 |
Source: Public Records
Map
Nearby Homes
Your Personal Tour Guide
Ask me questions while you tour the home.