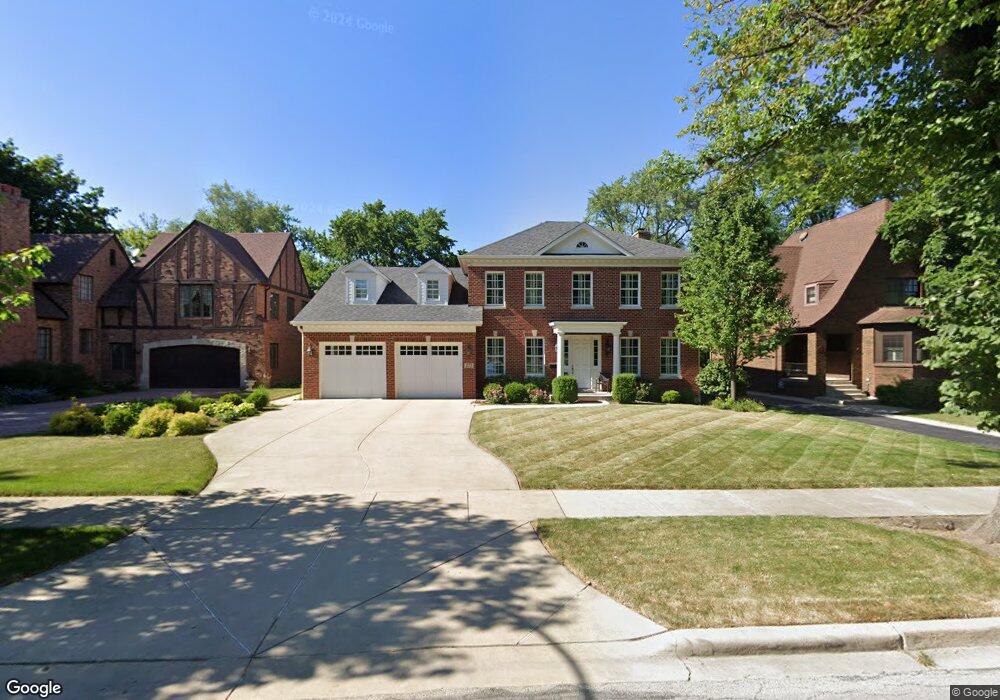
273 E Adelia St Elmhurst, IL 60126
Estimated Value: $1,030,000 - $1,204,382
Studio
--
Bath
2,860
Sq Ft
$391/Sq Ft
Est. Value
About This Home
This home is located at 273 E Adelia St, Elmhurst, IL 60126 and is currently estimated at $1,116,846, approximately $390 per square foot. 273 E Adelia St is a home located in DuPage County with nearby schools including Edison Elementary School, Sandburg Middle School, and York Community High School.
Ownership History
Date
Name
Owned For
Owner Type
Purchase Details
Closed on
Oct 21, 2010
Sold by
Vaneekeren Charles R
Bought by
Revocabl Vaneekeren Charles R and Charles R Van Eekeren Revocable Trust
Current Estimated Value
Home Financials for this Owner
Home Financials are based on the most recent Mortgage that was taken out on this home.
Original Mortgage
$417,000
Outstanding Balance
$3,025
Interest Rate
3.76%
Mortgage Type
New Conventional
Estimated Equity
$1,113,821
Purchase Details
Closed on
Jul 11, 2007
Sold by
Oconnor Robert E and Oconnor Nancy J
Bought by
Vaneekeren Charles R
Home Financials for this Owner
Home Financials are based on the most recent Mortgage that was taken out on this home.
Original Mortgage
$500,000
Interest Rate
6.37%
Mortgage Type
Adjustable Rate Mortgage/ARM
Create a Home Valuation Report for This Property
The Home Valuation Report is an in-depth analysis detailing your home's value as well as a comparison with similar homes in the area
Home Values in the Area
Average Home Value in this Area
Purchase History
| Date | Buyer | Sale Price | Title Company |
|---|---|---|---|
| Revocabl Vaneekeren Charles R | -- | Prairie Title Inc | |
| Vaneekeren Charles R | $645,000 | Multiple |
Source: Public Records
Mortgage History
| Date | Status | Borrower | Loan Amount |
|---|---|---|---|
| Open | Revocabl Vaneekeren Charles R | $417,000 | |
| Closed | Vaneekeren Charles R | $500,000 |
Source: Public Records
Tax History
| Year | Tax Paid | Tax Assessment Tax Assessment Total Assessment is a certain percentage of the fair market value that is determined by local assessors to be the total taxable value of land and additions on the property. | Land | Improvement |
|---|---|---|---|---|
| 2024 | $19,069 | $324,420 | $138,235 | $186,185 |
| 2023 | $17,727 | $300,000 | $127,830 | $172,170 |
| 2022 | $16,058 | $270,820 | $122,890 | $147,930 |
| 2021 | $15,665 | $264,080 | $119,830 | $144,250 |
| 2020 | $15,064 | $258,290 | $117,200 | $141,090 |
| 2019 | $15,126 | $245,570 | $111,430 | $134,140 |
| 2018 | $18,748 | $302,630 | $105,490 | $197,140 |
| 2017 | $18,374 | $288,380 | $100,520 | $187,860 |
| 2016 | $17,636 | $271,680 | $94,700 | $176,980 |
| 2015 | $17,489 | $253,100 | $88,220 | $164,880 |
| 2014 | $15,391 | $205,720 | $71,610 | $134,110 |
| 2013 | $15,220 | $208,620 | $72,620 | $136,000 |
Source: Public Records
Map
Nearby Homes
- 377 S Prairie Ave
- 153 S Kenmore Ave
- 176 S Arlington Ave
- 330 E Saint Charles Rd
- 406 S Poplar Ave
- 110 N Willow Rd
- 224 E May St
- 145 S York St Unit 404
- 135 S York St Unit 314
- 251 E South St
- 175 N Berteau Ave
- 131 W Adelaide St Unit 309
- 474 S York St
- 105 S Cottage Hill Ave Unit 304
- 105 S Cottage Hill Ave Unit 204
- 500 S Kenilworth Ave
- 444 E Schiller St
- 220 N Geneva Ave
- 209 N Maison Ct
- 515 S Parkview Ave
- 265 E Adelia St
- 281 E Adelia St
- 283 E Adelia St
- 261 E Adelia St
- 285 E Adelia St
- 268 E Forest Ave
- 272 E Forest Ave
- 264 E Forest Ave
- 257 E Adelia St
- 276 E Forest Ave
- 289 E Adelia St
- 271 S Lawndale Ave
- 260 E Forest Ave
- 282 E Forest Ave
- 280 E Adelia St
- 266 E Adelia St
- 256 E Forest Ave
- 256 E Adelia St
- 295 E Adelia St
- 288 E Forest Ave
Your Personal Tour Guide
Ask me questions while you tour the home.