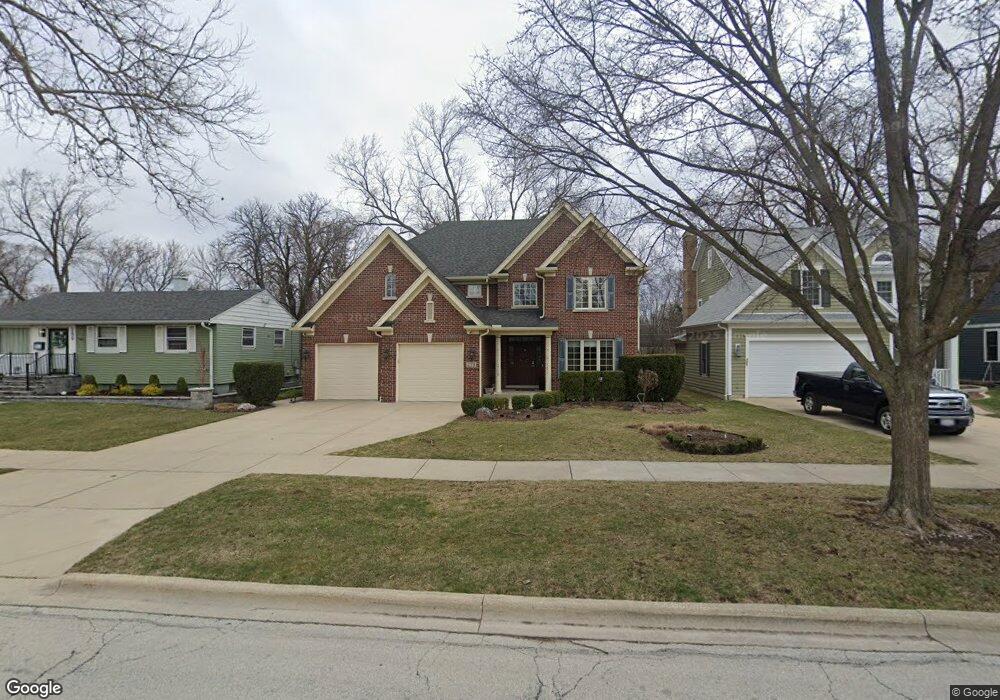
273 E Cayuga Ave Elmhurst, IL 60126
Estimated Value: $1,315,000 - $1,748,000
Studio
--
Bath
4,023
Sq Ft
$367/Sq Ft
Est. Value
About This Home
This home is located at 273 E Cayuga Ave, Elmhurst, IL 60126 and is currently estimated at $1,478,145, approximately $367 per square foot. 273 E Cayuga Ave is a home located in DuPage County with nearby schools including Jefferson Elementary School, Bryan Middle School, and York Community High School.
Ownership History
Date
Name
Owned For
Owner Type
Purchase Details
Closed on
May 19, 2004
Sold by
K Adams Builders Inc
Bought by
Chu William and Chu Queena
Current Estimated Value
Home Financials for this Owner
Home Financials are based on the most recent Mortgage that was taken out on this home.
Original Mortgage
$400,000
Outstanding Balance
$192,149
Interest Rate
5.85%
Mortgage Type
Purchase Money Mortgage
Estimated Equity
$1,285,996
Purchase Details
Closed on
Jul 28, 2003
Sold by
Suburban Home Buyers Llc
Bought by
K Adams Builders Inc
Home Financials for this Owner
Home Financials are based on the most recent Mortgage that was taken out on this home.
Original Mortgage
$175,000
Interest Rate
4.75%
Mortgage Type
Purchase Money Mortgage
Purchase Details
Closed on
Jul 31, 2002
Sold by
Gerbeck Claire
Bought by
Suburban Home Buyers Llc
Home Financials for this Owner
Home Financials are based on the most recent Mortgage that was taken out on this home.
Original Mortgage
$242,865
Interest Rate
6.7%
Create a Home Valuation Report for This Property
The Home Valuation Report is an in-depth analysis detailing your home's value as well as a comparison with similar homes in the area
Home Values in the Area
Average Home Value in this Area
Purchase History
| Date | Buyer | Sale Price | Title Company |
|---|---|---|---|
| Chu William | $720,000 | Ctic | |
| K Adams Builders Inc | $245,000 | First American Title | |
| Suburban Home Buyers Llc | $208,000 | First American Title |
Source: Public Records
Mortgage History
| Date | Status | Borrower | Loan Amount |
|---|---|---|---|
| Open | Chu William | $400,000 | |
| Previous Owner | K Adams Builders Inc | $175,000 | |
| Previous Owner | Suburban Home Buyers Llc | $242,865 | |
| Closed | Chu William | $50,000 |
Source: Public Records
Tax History
| Year | Tax Paid | Tax Assessment Tax Assessment Total Assessment is a certain percentage of the fair market value that is determined by local assessors to be the total taxable value of land and additions on the property. | Land | Improvement |
|---|---|---|---|---|
| 2024 | $21,566 | $365,848 | $105,685 | $260,163 |
| 2023 | $20,053 | $338,310 | $97,730 | $240,580 |
| 2022 | $20,478 | $343,710 | $93,960 | $249,750 |
| 2021 | $19,980 | $335,160 | $91,620 | $243,540 |
| 2020 | $19,215 | $327,810 | $89,610 | $238,200 |
| 2019 | $18,828 | $311,670 | $85,200 | $226,470 |
| 2018 | $20,164 | $331,480 | $80,650 | $250,830 |
| 2017 | $19,743 | $315,870 | $76,850 | $239,020 |
| 2016 | $19,355 | $297,570 | $72,400 | $225,170 |
| 2015 | $19,196 | $277,220 | $67,450 | $209,770 |
| 2014 | $15,181 | $202,990 | $53,540 | $149,450 |
| 2013 | $15,012 | $205,850 | $54,290 | $151,560 |
Source: Public Records
Map
Nearby Homes
- 274 E Crescent Ave
- 580 S Kearsage Ave
- 160 E Cayuga Ave
- 788 S Cambridge Ave
- 694 S York St
- 566 S Cedar Ave
- 837 S Kearsage Ave
- 251 E South St
- 224 E May St
- 500 S Kenilworth Ave
- 593 S Edgewood Ave
- 680 S Bryan St
- 494 E Atwood Ct
- 515 S Parkview Ave
- 353 E Butterfield Rd
- 857 S Euclid Ave
- 323 E Butterfield Rd
- 918 S Cambridge Ave
- 101 W Jackson St
- 406 S Poplar Ave
- 275 E Cayuga Ave
- 269 E Cayuga Ave
- 263 E Cayuga Ave
- 281 E Cayuga Ave
- 262 E Cayuga Ave
- 259 E Cayuga Ave
- 285 E Cayuga Ave
- 279 E Wilson St
- 273 E Wilson St
- 281 E Wilson St
- 282 E Crescent Ave
- 289 E Cayuga Ave
- 253 E Cayuga Ave
- 269 E Wilson St
- 290 E Crescent Ave
- 265 E Wilson St
- 289 E Wilson St
- 286 E Crescent Ave
- 293 E Cayuga Ave
- 250 E Cayuga Ave
Your Personal Tour Guide
Ask me questions while you tour the home.