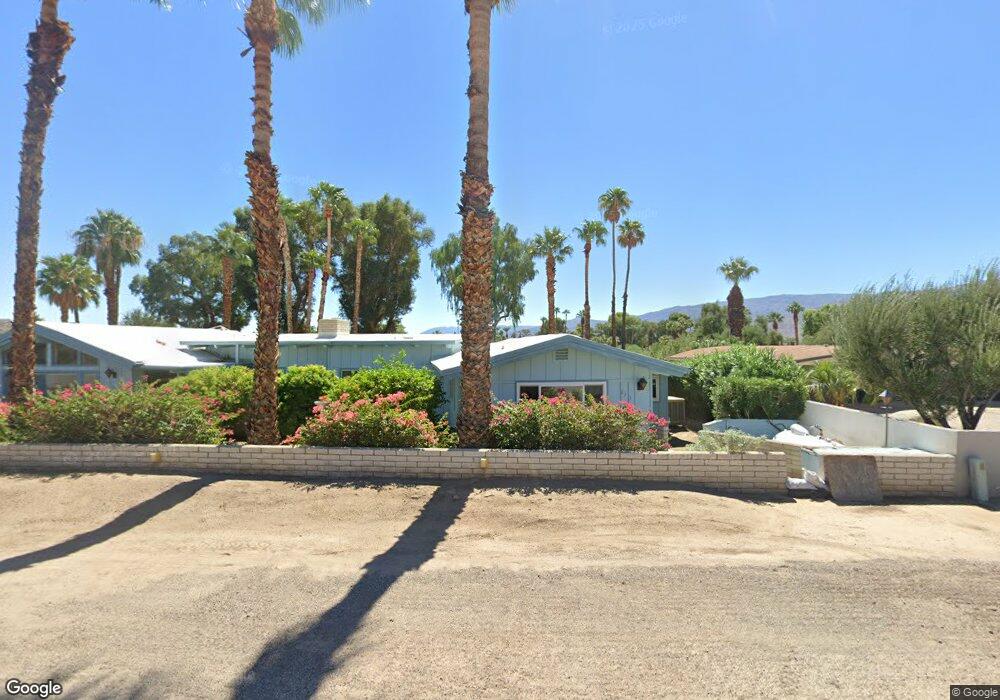
273 Montezuma Rd Borrego Springs, CA 92004
Estimated Value: $560,000 - $899,000
3
Beds
3
Baths
3,725
Sq Ft
$193/Sq Ft
Est. Value
About This Home
This home is located at 273 Montezuma Rd, Borrego Springs, CA 92004 and is currently estimated at $718,826, approximately $192 per square foot. 273 Montezuma Rd is a home with nearby schools including Borrego Springs Elementary School, Borrego Springs Middle School, and Borrego Springs High School.
Ownership History
Date
Name
Owned For
Owner Type
Purchase Details
Closed on
Aug 11, 2006
Sold by
Rearwin Stephen D and Rearwin Colleen T
Bought by
Rearwin Stephen D
Current Estimated Value
Purchase Details
Closed on
May 10, 2002
Sold by
Butcher Terrell James and Butcher Marily Jean
Bought by
Rearwin Stephen D and Rearwin Colleen T
Home Financials for this Owner
Home Financials are based on the most recent Mortgage that was taken out on this home.
Original Mortgage
$197,000
Interest Rate
6.51%
Purchase Details
Closed on
Apr 26, 1995
Sold by
Navarra Anthony G and Navarra Ninfa A
Bought by
Butcher Terrell James and Butcher Marilyn Jean
Home Financials for this Owner
Home Financials are based on the most recent Mortgage that was taken out on this home.
Original Mortgage
$75,000
Interest Rate
8.43%
Mortgage Type
Seller Take Back
Purchase Details
Closed on
Dec 14, 1994
Sold by
Wieghorst Roy and Casper William C
Bought by
Navarra Anthony G and Navarra Ninfa A
Create a Home Valuation Report for This Property
The Home Valuation Report is an in-depth analysis detailing your home's value as well as a comparison with similar homes in the area
Home Values in the Area
Average Home Value in this Area
Purchase History
| Date | Buyer | Sale Price | Title Company |
|---|---|---|---|
| Rearwin Stephen D | -- | None Available | |
| Rearwin Stephen D | $256,500 | Chicago Title Co | |
| Butcher Terrell James | $220,000 | Old Republic Title Co | |
| Navarra Anthony G | $100,000 | Old Republic Title Company |
Source: Public Records
Mortgage History
| Date | Status | Borrower | Loan Amount |
|---|---|---|---|
| Previous Owner | Rearwin Stephen D | $197,000 | |
| Previous Owner | Butcher Terrell James | $75,000 | |
| Closed | Butcher Terrell James | $119,000 |
Source: Public Records
Tax History Compared to Growth
Tax History
| Year | Tax Paid | Tax Assessment Tax Assessment Total Assessment is a certain percentage of the fair market value that is determined by local assessors to be the total taxable value of land and additions on the property. | Land | Improvement |
|---|---|---|---|---|
| 2025 | $3,674 | $347,584 | $79,651 | $267,933 |
| 2024 | $3,674 | $340,770 | $78,090 | $262,680 |
| 2023 | $3,596 | $334,089 | $76,559 | $257,530 |
| 2022 | $3,542 | $327,539 | $75,058 | $252,481 |
| 2021 | $3,479 | $321,118 | $73,587 | $247,531 |
| 2020 | $3,468 | $317,826 | $72,833 | $244,993 |
| 2019 | $3,223 | $311,595 | $71,405 | $240,190 |
| 2018 | $3,158 | $305,486 | $70,005 | $235,481 |
| 2017 | $3,095 | $299,497 | $68,633 | $230,864 |
| 2016 | $3,024 | $293,626 | $67,288 | $226,338 |
| 2015 | $2,980 | $289,217 | $66,278 | $222,939 |
| 2014 | $2,910 | $283,552 | $64,980 | $218,572 |
Source: Public Records
Map
Nearby Homes
- 196 Montezuma Rd
- 202 Pointing Rock Dr Unit 19
- 202 Pointing Rock Dr Unit 15
- 119 Montezuma Rd
- 347 Wheel Hub Place
- 1682 Montezuma Ct Unit 13
- 406 Santa fe Trail
- 581 Catarina Dr
- 1 Laramie St
- 2 Hauberk Dr
- 2 Lazy Dr S
- 1 Lazy Dr S
- 0 Lazy S Unit NDP2402705
- 2039 Lazy Dr S
- 0 Verbena Dr Unit IV25127409
- 341 Ocotillo Cir
- 373 Ocotillo Cir
- 0 di Giorgio Rd Unit NDP2509926
- 0 di Giorgio Rd Unit NDP2509925
- 3689 di Giorgio Rd
- 269 Montezuma Rd
- 281 Montezuma Rd
- 276 Montezuma Rd
- 287 Montezuma Rd
- Lot 153 Montezuma Dr Unit 153
- 258 Montezuma Dr
- 255 Montezuma Rd
- 293 Montezuma Dr
- 292 Montezuma Rd
- 1660 De Anza Dr
- 247 Montezuma Rd
- 1652 De Anza Dr
- 1670 De Anza Dr
- 1680 De Anza Dr
- 1638 De Anza Dr
- 1606 Yaqui Rd
- 1688 De Anza Dr
- 90 Yaqui Rd
- 80 Yaqui Rd
- 0 De Anza Dr Unit 180053945