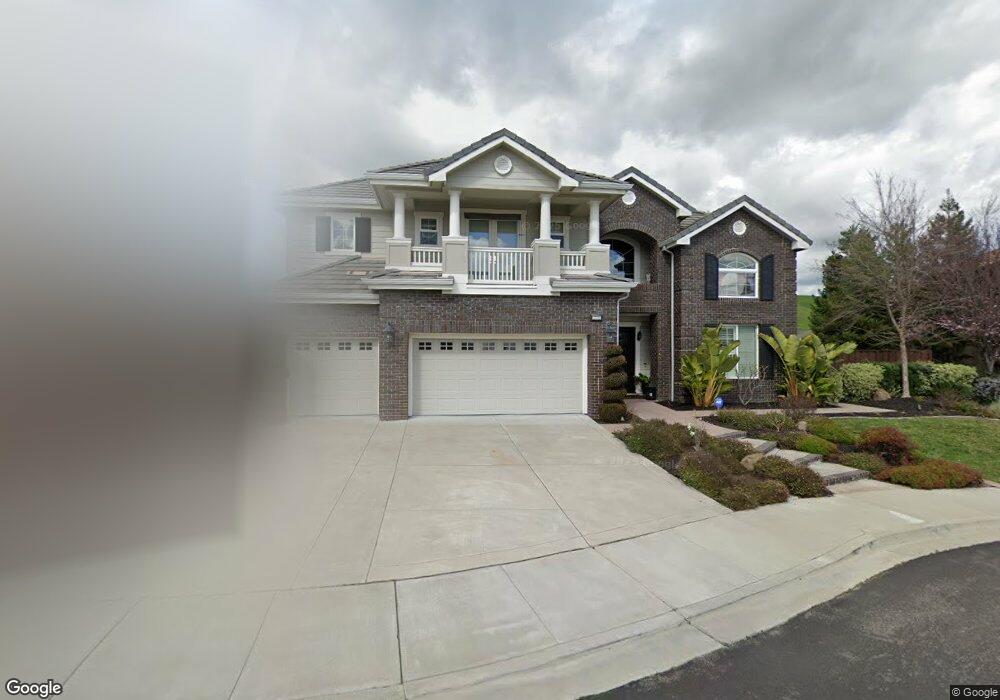
2731 E Cog Hill Terrace Dublin, CA 94568
Dublin Ranch NeighborhoodEstimated Value: $2,687,191 - $3,168,000
5
Beds
5
Baths
4,886
Sq Ft
$580/Sq Ft
Est. Value
About This Home
This home is located at 2731 E Cog Hill Terrace, Dublin, CA 94568 and is currently estimated at $2,834,548, approximately $580 per square foot. 2731 E Cog Hill Terrace is a home located in Alameda County with nearby schools including J.M. Amador Elementary School, Dublin High School, and The Quarry Lane School.
Ownership History
Date
Name
Owned For
Owner Type
Purchase Details
Closed on
Oct 28, 2015
Sold by
Lee Sung Han and Lee Yevonne C
Bought by
Khan Ammad M and Banin Zahra
Current Estimated Value
Home Financials for this Owner
Home Financials are based on the most recent Mortgage that was taken out on this home.
Original Mortgage
$1,240,000
Outstanding Balance
$975,982
Interest Rate
3.81%
Mortgage Type
New Conventional
Estimated Equity
$1,858,566
Purchase Details
Closed on
Mar 14, 2005
Sold by
Toll Ca Ii Lp
Bought by
Lee Sung Han and Lee Yevonne C
Home Financials for this Owner
Home Financials are based on the most recent Mortgage that was taken out on this home.
Original Mortgage
$950,000
Interest Rate
5.37%
Mortgage Type
Purchase Money Mortgage
Create a Home Valuation Report for This Property
The Home Valuation Report is an in-depth analysis detailing your home's value as well as a comparison with similar homes in the area
Home Values in the Area
Average Home Value in this Area
Purchase History
| Date | Buyer | Sale Price | Title Company |
|---|---|---|---|
| Khan Ammad M | $1,550,000 | Chicago Title Company | |
| Lee Sung Han | $1,492,000 | First American Title Co |
Source: Public Records
Mortgage History
| Date | Status | Borrower | Loan Amount |
|---|---|---|---|
| Open | Khan Ammad M | $1,240,000 | |
| Previous Owner | Lee Sung Han | $950,000 |
Source: Public Records
Tax History Compared to Growth
Tax History
| Year | Tax Paid | Tax Assessment Tax Assessment Total Assessment is a certain percentage of the fair market value that is determined by local assessors to be the total taxable value of land and additions on the property. | Land | Improvement |
|---|---|---|---|---|
| 2025 | $23,642 | $1,834,842 | $556,371 | $1,278,471 |
| 2024 | $23,642 | $1,798,867 | $545,463 | $1,253,404 |
| 2023 | $23,405 | $1,763,604 | $534,770 | $1,228,834 |
| 2022 | $23,132 | $1,729,025 | $524,285 | $1,204,740 |
| 2021 | $22,948 | $1,695,126 | $514,006 | $1,181,120 |
| 2020 | $21,469 | $1,677,750 | $508,737 | $1,169,013 |
| 2019 | $21,536 | $1,644,860 | $498,764 | $1,146,096 |
| 2018 | $21,055 | $1,612,620 | $488,988 | $1,123,632 |
| 2017 | $20,796 | $1,581,000 | $479,400 | $1,101,600 |
| 2016 | $18,946 | $1,550,000 | $470,000 | $1,080,000 |
| 2015 | $17,045 | $1,420,000 | $426,000 | $994,000 |
| 2014 | $16,908 | $1,377,000 | $413,100 | $963,900 |
Source: Public Records
Map
Nearby Homes
- 2848 E Cog Hill Terrace
- 2528 Amantea Way
- 6010 Turnberry Dr
- 6013 Kingsmill Terrace
- 2371 Capistrello St
- 3005 Vittoria Loop
- 3105 Vittoria Loop
- 3135 Vittoria Loop
- 3956 Jordan Ranch Dr
- 3970 Jordan Ranch Dr
- 4456 Sunset View Dr
- 4369 Table Mountain Rd
- 4439 Sunset View Dr
- 3898 Highpointe Ct
- 1856 S Terracina Dr
- 1937 Whitney Ave
- 1691 S Wren St
- 2378 Carbondale Way
- 4287 Loyalton Rd
- 2336 Carbondale Way
- 2757 E Cog Hill Terrace
- 2725 E Cog Hill Terrace
- 2752 E Cog Hill Terrace
- 5695 Saddle Creek Terrace
- 2771 E Cog Hill Terrace
- 2768 E Cog Hill Terrace
- 5681 Saddle Creek Terrace
- 2787 E Cog Hill Terrace
- 2782 E Cog Hill Terrace
- 2701 Highlands Meadows Ct
- 2709 Highlands Meadows Ct
- 5673 Saddle Creek Terrace
- 2805 E Cog Hill Terrace
- 2796 E Cog Hill Terrace
- 2721 Highlands Meadows Ct
- 5655 Saddle Creek Terrace
- 2824 E Cog Hill Terrace
- 2827 E Cog Hill Terrace
- 2700 Highland Meadows Ct
- 2733 Highlands Meadows Ct