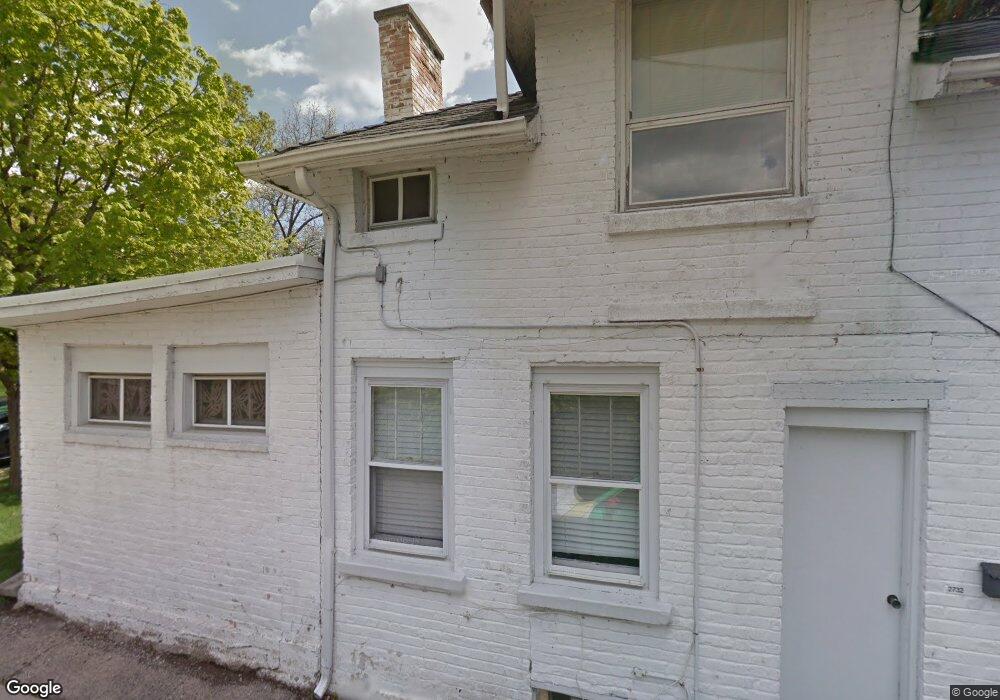
2732 Fort Sheridan Ave Highland Park, IL 60035
East Highland Park NeighborhoodEstimated Value: $510,000 - $701,000
4
Beds
3
Baths
2,118
Sq Ft
$299/Sq Ft
Est. Value
About This Home
This home is located at 2732 Fort Sheridan Ave, Highland Park, IL 60035 and is currently estimated at $633,599, approximately $299 per square foot. 2732 Fort Sheridan Ave is a home located in Lake County with nearby schools including Indian Trail Elementary School, Edgewood Middle School, and Highland Park High School.
Ownership History
Date
Name
Owned For
Owner Type
Purchase Details
Closed on
Jun 29, 2017
Sold by
Ventures Trust 2013 I H R
Bought by
Katsnelson Alex
Current Estimated Value
Purchase Details
Closed on
Oct 12, 2013
Sold by
Werhane Lorenz J and Panei Werhane Lisa
Bought by
Ventures Trust 2013-I-Nh and Mcm Capital Partners Llc
Purchase Details
Closed on
Nov 29, 2007
Sold by
Werhane Theresa A and The Lorenz J Werhane Revocable
Bought by
Werhane Lorenz J and Panei Werhane Lisa
Home Financials for this Owner
Home Financials are based on the most recent Mortgage that was taken out on this home.
Original Mortgage
$320,000
Interest Rate
6.27%
Mortgage Type
Purchase Money Mortgage
Purchase Details
Closed on
Feb 11, 2006
Sold by
Werhane Theresa A and The Lorenz J Werhane Revocable
Bought by
Werhane Theresa A and The Theresa A Werhane Revocabl
Purchase Details
Closed on
Jun 19, 1998
Sold by
Werhane Lorenz J and Werhane Theresa A
Bought by
The Lorenz J Werhane Revocable Trust and The Theresa A Werhane Revocable Trust
Create a Home Valuation Report for This Property
The Home Valuation Report is an in-depth analysis detailing your home's value as well as a comparison with similar homes in the area
Home Values in the Area
Average Home Value in this Area
Purchase History
| Date | Buyer | Sale Price | Title Company |
|---|---|---|---|
| Katsnelson Alex | $260,000 | Attorney | |
| Ventures Trust 2013-I-Nh | -- | Linear Title & Closing | |
| Werhane Lorenz J | $460,000 | None Available | |
| Werhane Theresa A | -- | None Available | |
| The Lorenz J Werhane Revocable Trust | -- | -- |
Source: Public Records
Mortgage History
| Date | Status | Borrower | Loan Amount |
|---|---|---|---|
| Previous Owner | Werhane Lorenz J | $320,000 |
Source: Public Records
Tax History Compared to Growth
Tax History
| Year | Tax Paid | Tax Assessment Tax Assessment Total Assessment is a certain percentage of the fair market value that is determined by local assessors to be the total taxable value of land and additions on the property. | Land | Improvement |
|---|---|---|---|---|
| 2024 | $14,281 | $180,606 | $63,957 | $116,649 |
| 2023 | $11,985 | $162,796 | $57,650 | $105,146 |
| 2022 | $11,985 | $133,085 | $63,331 | $69,754 |
| 2021 | $11,057 | $128,647 | $61,219 | $67,428 |
| 2020 | $10,700 | $128,647 | $61,219 | $67,428 |
| 2019 | $10,337 | $128,046 | $60,933 | $67,113 |
| 2018 | $9,196 | $118,840 | $56,654 | $62,186 |
| 2017 | $8,914 | $118,154 | $56,327 | $61,827 |
| 2016 | $8,145 | $112,484 | $53,624 | $58,860 |
| 2015 | $7,697 | $102,272 | $49,823 | $52,449 |
| 2014 | $7,539 | $98,047 | $48,397 | $49,650 |
| 2012 | $7,343 | $98,619 | $48,679 | $49,940 |
Source: Public Records
Map
Nearby Homes
- 0 Moraine Rd
- 417 Temple Ave
- 2542 Green Bay Rd
- 2500 Green Bay Rd
- 1 Burtis Ave
- 0 Skokie Ave
- 2441 Woodbridge Ln
- 0 Wrendale Ave Unit MRD12487576
- 221 Burchell Ave
- 228 Llewellyn Ave
- 0 Patten Rd
- 560 Vine Ave Unit 103
- 2046 Saint Johns Ave Unit 2A
- 2086 Saint Johns Ave Unit 207
- 525 Lockard Ln
- 2066 Saint Johns Ave Unit 404
- 535 Lockard Ln
- 2514 Hidden Oak (Lot 9) Cir
- 626 Homewood Ave Unit 401
- 940 Augusta Way Unit 304
- 271 Bloom St
- 2744 Fort Sheridan Ave
- 2720 Fort Sheridan Ave
- 2721 Saint Johns Ave
- 2731 Saint Johns Ave
- 2714 Fort Sheridan Ave
- 2754 Fort Sheridan Ave
- 2755 Saint Johns Ave
- 257 Bloom St
- 2770 Fort Sheridan Ave
- 2767 Saint Johns Ave
- 300 Temple Ave
- 2715 Fort Sheridan Ave
- 2771 Saint Johns Ave
- 2735 Fort Sheridan Ave
- 303 Bloom St
- 2747 Fort Sheridan Ave
- 2675 Saint Johns Ave
- 228 Walker Ave
- 220 Walker Ave