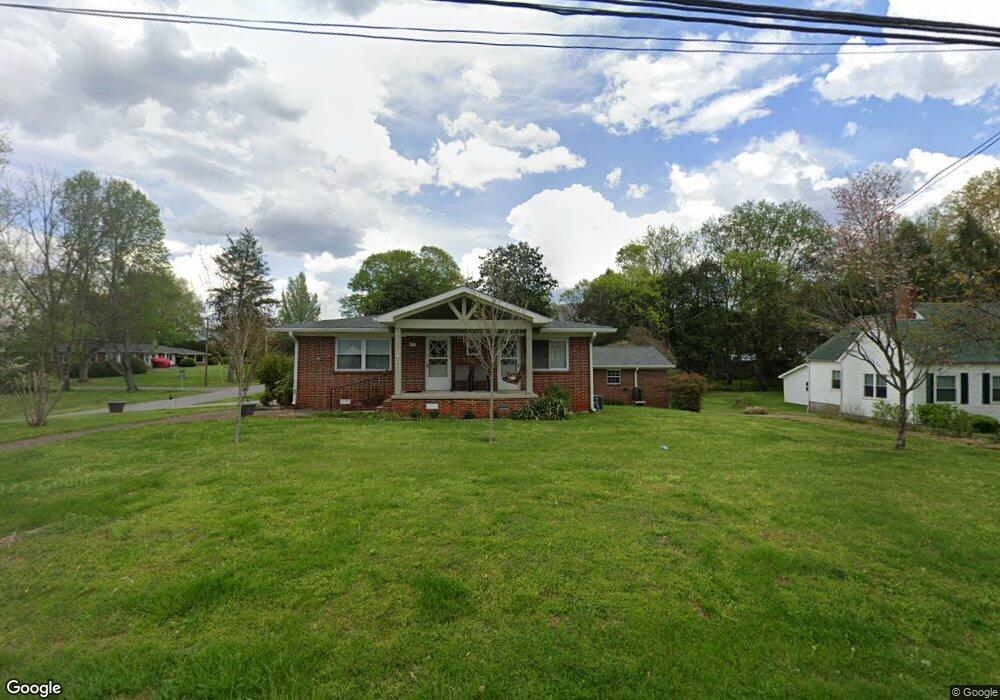
2732 Main St Pikeville, TN 37367
Estimated Value: $188,000 - $248,000
3
Beds
3
Baths
2,280
Sq Ft
$95/Sq Ft
Est. Value
About This Home
This home is located at 2732 Main St, Pikeville, TN 37367 and is currently estimated at $217,093, approximately $95 per square foot. 2732 Main St is a home located in Bledsoe County with nearby schools including Bledsoe County High School, Pikeville SDA School, and Sampson Christian Academy.
Ownership History
Date
Name
Owned For
Owner Type
Purchase Details
Closed on
Sep 18, 2015
Sold by
Holt John R Suc
Bought by
Pendergrass Joyce Michelle
Current Estimated Value
Home Financials for this Owner
Home Financials are based on the most recent Mortgage that was taken out on this home.
Original Mortgage
$69,350
Outstanding Balance
$54,264
Interest Rate
3.88%
Mortgage Type
New Conventional
Estimated Equity
$162,829
Purchase Details
Closed on
Dec 12, 2003
Sold by
Holt Eula M
Bought by
Holt John R Eula Liv Tru
Purchase Details
Closed on
Feb 21, 1994
Bought by
Holt John R and Holt Eula M
Purchase Details
Closed on
Feb 17, 1994
Bought by
Holt John R and Holt Eula M
Purchase Details
Closed on
Feb 9, 1994
Bought by
Holt John R and Holt Eula M
Purchase Details
Closed on
May 29, 1991
Bought by
Cunningham Wade E
Create a Home Valuation Report for This Property
The Home Valuation Report is an in-depth analysis detailing your home's value as well as a comparison with similar homes in the area
Home Values in the Area
Average Home Value in this Area
Purchase History
| Date | Buyer | Sale Price | Title Company |
|---|---|---|---|
| Pendergrass Joyce Michelle | $73,000 | -- | |
| Holt John R Eula Liv Tru | -- | -- | |
| Holt John R | -- | -- | |
| Holt John R | -- | -- | |
| Holt John R | $42,000 | -- | |
| Cunningham Wade E | $4,000 | -- |
Source: Public Records
Mortgage History
| Date | Status | Borrower | Loan Amount |
|---|---|---|---|
| Open | Pendergrass Joyce Michelle | $69,350 |
Source: Public Records
Tax History Compared to Growth
Tax History
| Year | Tax Paid | Tax Assessment Tax Assessment Total Assessment is a certain percentage of the fair market value that is determined by local assessors to be the total taxable value of land and additions on the property. | Land | Improvement |
|---|---|---|---|---|
| 2025 | $961 | $31,350 | $0 | $0 |
| 2024 | $961 | $31,350 | $4,000 | $27,350 |
| 2023 | $961 | $31,350 | $4,000 | $27,350 |
| 2022 | $901 | $31,350 | $4,000 | $27,350 |
| 2021 | $639 | $18,875 | $3,750 | $15,125 |
| 2020 | $639 | $18,875 | $3,750 | $15,125 |
| 2019 | $639 | $18,875 | $3,750 | $15,125 |
| 2018 | $605 | $18,875 | $3,750 | $15,125 |
| 2017 | $577 | $18,875 | $3,750 | $15,125 |
| 2016 | $591 | $19,025 | $2,500 | $16,525 |
| 2015 | $582 | $19,050 | $2,500 | $16,550 |
| 2014 | $582 | $19,050 | $2,500 | $16,550 |
Source: Public Records
Map
Nearby Homes
- 188 Howard St
- 133 Cherry St
- 100 W Legion Cir
- 15 Pratt St
- 123 S Grove St
- 0 Old State Hwy Unit 1243345
- 0 Old State Hwy Unit RTC2918870
- 0 U S 127
- 50 Upper East Valley Rd
- 7511 Upper East Valley Rd
- 13 Upper East Valley Rd
- 013 Upper East Valley Rd
- 0 Upper East Valley Rd
- 110 Cleveland Ave
- 35290 Tennessee 30
- 89 Southgate Ln
- 14 Titans Ln
- 134 Blaine St
- 00 Mountain Lake Cir
- 1344 U S 127 Bypass