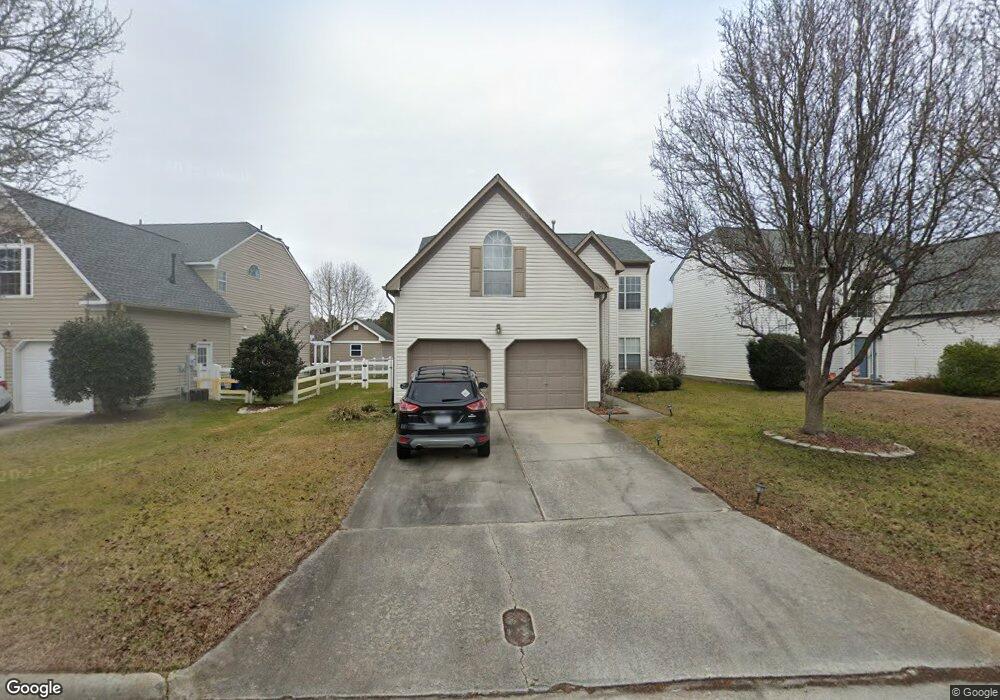
2732 Mulberry Loop Virginia Beach, VA 23456
Dam Neck NeighborhoodEstimated Value: $560,000 - $584,000
4
Beds
3
Baths
2,434
Sq Ft
$234/Sq Ft
Est. Value
About This Home
This home is located at 2732 Mulberry Loop, Virginia Beach, VA 23456 and is currently estimated at $569,752, approximately $234 per square foot. 2732 Mulberry Loop is a home located in Virginia Beach City with nearby schools including Strawbridge Elementary School, Corporate Landing Middle School, and Landstown High School.
Ownership History
Date
Name
Owned For
Owner Type
Purchase Details
Closed on
May 31, 2022
Sold by
Hynes Jr George W
Bought by
Valsan Ajith Kollamparamb and Sukumaran Anjaly
Current Estimated Value
Home Financials for this Owner
Home Financials are based on the most recent Mortgage that was taken out on this home.
Original Mortgage
$446,500
Outstanding Balance
$423,629
Interest Rate
5.11%
Mortgage Type
New Conventional
Estimated Equity
$146,123
Purchase Details
Closed on
Jun 25, 2010
Sold by
Casey Brice D
Bought by
Hynes George W
Home Financials for this Owner
Home Financials are based on the most recent Mortgage that was taken out on this home.
Original Mortgage
$272,800
Interest Rate
4.78%
Mortgage Type
New Conventional
Purchase Details
Closed on
Jul 31, 2000
Sold by
Affordable Homes L L C I
Bought by
Casey Bruce D
Home Financials for this Owner
Home Financials are based on the most recent Mortgage that was taken out on this home.
Original Mortgage
$154,340
Interest Rate
8.1%
Create a Home Valuation Report for This Property
The Home Valuation Report is an in-depth analysis detailing your home's value as well as a comparison with similar homes in the area
Home Values in the Area
Average Home Value in this Area
Purchase History
| Date | Buyer | Sale Price | Title Company |
|---|---|---|---|
| Valsan Ajith Kollamparamb | $470,000 | Fidelity National Title | |
| Hynes George W | $340,000 | -- | |
| Casey Bruce D | $164,340 | -- |
Source: Public Records
Mortgage History
| Date | Status | Borrower | Loan Amount |
|---|---|---|---|
| Open | Valsan Ajith Kollamparamb | $446,500 | |
| Previous Owner | Hynes George W | $272,800 | |
| Previous Owner | Casey Bruce D | $154,340 |
Source: Public Records
Tax History Compared to Growth
Tax History
| Year | Tax Paid | Tax Assessment Tax Assessment Total Assessment is a certain percentage of the fair market value that is determined by local assessors to be the total taxable value of land and additions on the property. | Land | Improvement |
|---|---|---|---|---|
| 2025 | $4,856 | $509,200 | $195,000 | $314,200 |
| 2024 | $4,856 | $500,600 | $195,000 | $305,600 |
| 2023 | $4,543 | $458,900 | $180,000 | $278,900 |
| 2022 | $4,187 | $422,900 | $146,000 | $276,900 |
| 2021 | $3,824 | $386,300 | $133,000 | $253,300 |
| 2020 | $3,656 | $359,300 | $126,000 | $233,300 |
| 2019 | $3,555 | $335,200 | $117,000 | $218,200 |
| 2018 | $3,360 | $335,200 | $117,000 | $218,200 |
| 2017 | $3,253 | $324,500 | $112,500 | $212,000 |
| 2016 | $3,219 | $325,200 | $112,500 | $212,700 |
| 2015 | $3,258 | $329,100 | $116,400 | $212,700 |
| 2014 | $2,723 | $317,700 | $116,400 | $201,300 |
Source: Public Records
Map
Nearby Homes
- 2629 Mulberry Loop
- 2564 Penshurst Way
- 1892 Somersby Ln
- 2324 Barnsely Ct
- 2512 Olympic Ct
- 2568 Placid Place
- 1789 Olympic Dr
- 2540 Windy Pines Bend
- 1700 Mayberry Dr
- 2001 Melstone Dr
- 2304 Apple Tree Crescent
- 2956 Chestwood Bend
- 2541 Buyrn Cir
- 2404 Belle Ct
- 1909 Maple Shade Dr
- 2009 Dry Creek Ct
- 2808 Wakehurst Ct
- 2609 Hunters Run Trail
- 2312 Kilburton Priory Ct
- 1905 Red Barn Dr
- 2736 Mulberry Loop
- 2728 Mulberry Loop
- 2724 Mulberry Loop
- 2740 Mulberry Loop
- 2729 Mulberry Loop
- 2733 Mulberry Loop
- 2720 Mulberry Loop
- 2744 Mulberry Loop
- 2737 Mulberry Loop
- 2725 Mulberry Loop
- 2741 Mulberry Loop
- 2716 Mulberry Loop
- 2745 Mulberry Loop
- 2553 Mulberry Loop
- 2549 Mulberry Loop
- 2717 Mulberry Loop
- 2557 Mulberry Loop
- 2545 Mulberry Loop
- 2712 Mulberry Loop
- 2752 Mulberry Loop