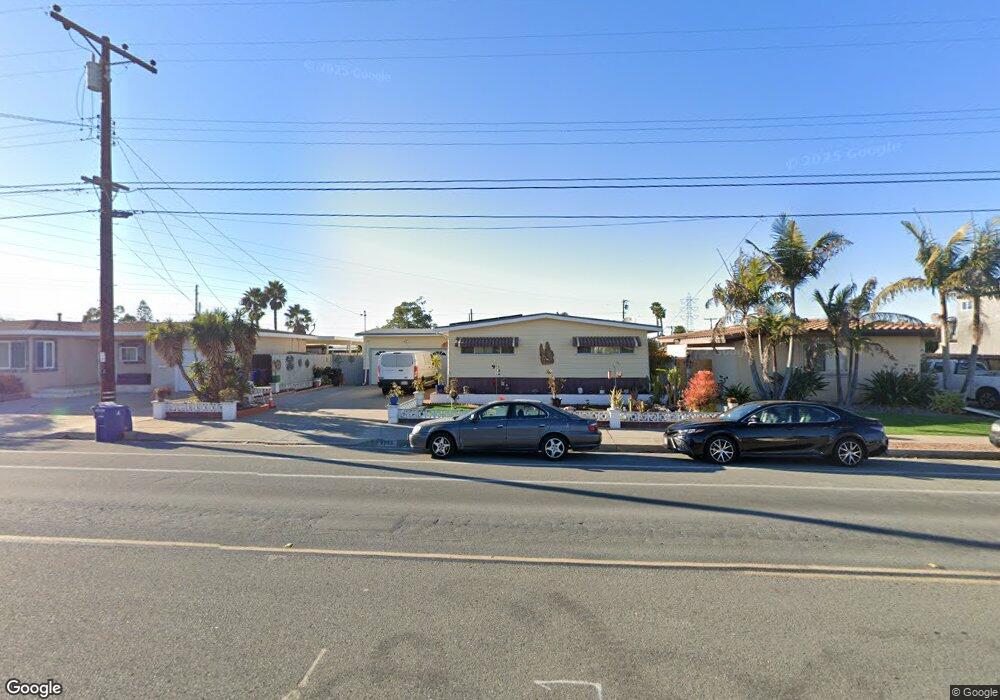
2732 Murray Ridge Rd San Diego, CA 92123
Serra Mesa NeighborhoodEstimated Value: $1,031,000 - $1,124,389
3
Beds
2
Baths
1,749
Sq Ft
$609/Sq Ft
Est. Value
About This Home
This home is located at 2732 Murray Ridge Rd, San Diego, CA 92123 and is currently estimated at $1,065,347, approximately $609 per square foot. 2732 Murray Ridge Rd is a home located in San Diego County with nearby schools including Jones Elementary School, Taft Middle School, and Elevate Elementary School.
Ownership History
Date
Name
Owned For
Owner Type
Purchase Details
Closed on
Mar 31, 2014
Sold by
Camfield Richard N and Kuglen Barbara Joan
Bought by
Zhang Kevin L and Gao Wenjing
Current Estimated Value
Home Financials for this Owner
Home Financials are based on the most recent Mortgage that was taken out on this home.
Original Mortgage
$270,000
Outstanding Balance
$204,397
Interest Rate
4.23%
Mortgage Type
New Conventional
Estimated Equity
$860,950
Purchase Details
Closed on
Mar 3, 2011
Sold by
The Trust and Kennedy Shirley Ann
Bought by
Camfield Richard N and Kuglen Barbara Joan
Home Financials for this Owner
Home Financials are based on the most recent Mortgage that was taken out on this home.
Original Mortgage
$333,300
Interest Rate
4.75%
Mortgage Type
FHA
Purchase Details
Closed on
Nov 18, 2008
Sold by
Kennedy Shirley Ann
Bought by
Kennedy Shirley Ann
Purchase Details
Closed on
Jun 10, 1995
Sold by
Graham Harry M and Graham Gladys L
Bought by
Graham Harry M and Graham Gladys L
Create a Home Valuation Report for This Property
The Home Valuation Report is an in-depth analysis detailing your home's value as well as a comparison with similar homes in the area
Home Values in the Area
Average Home Value in this Area
Purchase History
| Date | Buyer | Sale Price | Title Company |
|---|---|---|---|
| Zhang Kevin L | $425,000 | None Available | |
| Camfield Richard N | $364,000 | Chicago Title Company | |
| Kennedy Shirley Ann | -- | None Available | |
| Graham Harry M | -- | -- |
Source: Public Records
Mortgage History
| Date | Status | Borrower | Loan Amount |
|---|---|---|---|
| Open | Zhang Kevin L | $270,000 | |
| Previous Owner | Camfield Richard N | $333,300 |
Source: Public Records
Tax History Compared to Growth
Tax History
| Year | Tax Paid | Tax Assessment Tax Assessment Total Assessment is a certain percentage of the fair market value that is determined by local assessors to be the total taxable value of land and additions on the property. | Land | Improvement |
|---|---|---|---|---|
| 2025 | $6,583 | $551,028 | $363,543 | $187,485 |
| 2024 | $6,583 | $540,224 | $356,415 | $183,809 |
| 2023 | $6,436 | $529,632 | $349,427 | $180,205 |
| 2022 | $6,264 | $519,248 | $342,576 | $176,672 |
| 2021 | $6,219 | $509,067 | $335,859 | $173,208 |
| 2020 | $6,143 | $503,848 | $332,416 | $171,432 |
| 2019 | $6,032 | $493,970 | $325,899 | $168,071 |
| 2018 | $5,721 | $484,285 | $319,509 | $164,776 |
| 2017 | $5,585 | $474,791 | $313,245 | $161,546 |
| 2016 | $5,496 | $465,482 | $307,103 | $158,379 |
| 2015 | $5,415 | $458,491 | $302,491 | $156,000 |
| 2014 | $4,433 | $380,423 | $265,460 | $114,963 |
Source: Public Records
Map
Nearby Homes
- 8874 Gowdy Ave
- 2421 Casement St
- 8441 Encino Ave
- 3216 Towser St
- 3161 Skipper St
- 2750 Walker Dr
- 7830 Nightingale Way
- 7813 Starling Dr
- 7810 Nightingale Way
- 8805 Laddie Ln
- 2376 Ron Way
- 8955 Gramercy Dr
- 8975 Gramercy Dr
- 7855 Hummingbird Ln
- 2660 Pheasant Dr
- 2706 Via Alta Place
- 2921 Via Alta Place
- 8355 Summit Way
- 9178 Irvington Ave
- 3531 Milagros St
- 2722 Murray Ridge Rd
- 2742 Murray Ridge Rd
- 2771 Chalar St
- 2731 Chalar St
- 2751 Chalar St
- 2752 Murray Ridge Rd
- 2781 Chalar St
- 2712 Murray Ridge Rd
- 2791 Chalar St
- 2731 Murray Ridge Rd
- 2741 Murray Ridge Rd
- 2721 Murray Ridge Rd
- 2762 Murray Ridge Rd
- 2751 Murray Ridge Rd
- 2711 Murray Ridge Rd
- 2805 Chalar St
- 2761 Murray Ridge Rd
- 2802 Murray Ridge Rd
- 2701 Murray Ridge Rd
- 2762 Chalar St