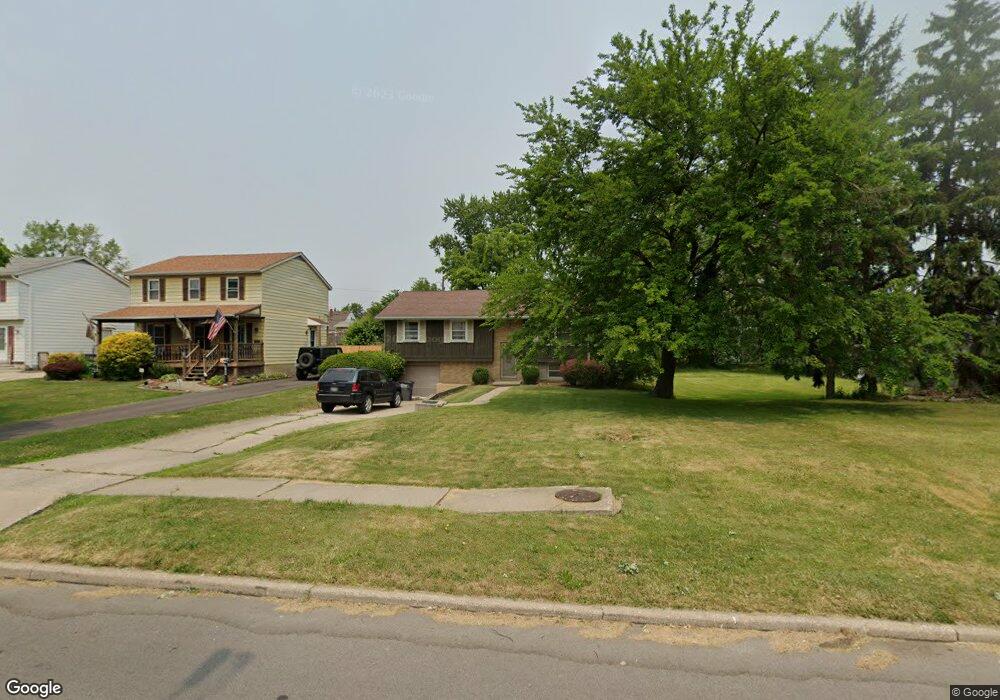
2733 101st St Toledo, OH 43611
Point Place NeighborhoodEstimated Value: $179,000 - $200,000
3
Beds
2
Baths
1,515
Sq Ft
$126/Sq Ft
Est. Value
About This Home
This home is located at 2733 101st St, Toledo, OH 43611 and is currently estimated at $191,616, approximately $126 per square foot. 2733 101st St is a home located in Lucas County with nearby schools including Ottawa River Elementary School, Woodward High School, and Imagine Environmental Science Academy.
Ownership History
Date
Name
Owned For
Owner Type
Purchase Details
Closed on
Apr 10, 2013
Sold by
Binkley David A
Bought by
Gent Jennifer Leigh
Current Estimated Value
Purchase Details
Closed on
Jul 30, 2002
Sold by
Gent Robert G and Gent Wendy L
Bought by
Binkley David A and Gent Jennifer L
Home Financials for this Owner
Home Financials are based on the most recent Mortgage that was taken out on this home.
Original Mortgage
$58,500
Interest Rate
6.7%
Purchase Details
Closed on
Mar 23, 1990
Sold by
Cortez Delores
Create a Home Valuation Report for This Property
The Home Valuation Report is an in-depth analysis detailing your home's value as well as a comparison with similar homes in the area
Home Values in the Area
Average Home Value in this Area
Purchase History
| Date | Buyer | Sale Price | Title Company |
|---|---|---|---|
| Gent Jennifer Leigh | -- | None Available | |
| Binkley David A | $65,000 | Port Lawrence Title | |
| -- | $57,000 | -- |
Source: Public Records
Mortgage History
| Date | Status | Borrower | Loan Amount |
|---|---|---|---|
| Previous Owner | Binkley David A | $58,500 |
Source: Public Records
Tax History Compared to Growth
Tax History
| Year | Tax Paid | Tax Assessment Tax Assessment Total Assessment is a certain percentage of the fair market value that is determined by local assessors to be the total taxable value of land and additions on the property. | Land | Improvement |
|---|---|---|---|---|
| 2024 | $1,634 | $52,990 | $6,580 | $46,410 |
| 2023 | $2,713 | $41,720 | $6,650 | $35,070 |
| 2022 | $2,715 | $41,720 | $6,650 | $35,070 |
| 2021 | $2,782 | $41,720 | $6,650 | $35,070 |
| 2020 | $2,632 | $34,755 | $5,565 | $29,190 |
| 2019 | $2,562 | $34,755 | $5,565 | $29,190 |
| 2018 | $2,428 | $34,755 | $5,565 | $29,190 |
| 2017 | $2,307 | $29,400 | $4,690 | $24,710 |
| 2016 | $2,304 | $84,000 | $13,400 | $70,600 |
| 2015 | $2,284 | $84,000 | $13,400 | $70,600 |
| 2014 | $2,850 | $29,400 | $4,690 | $24,710 |
| 2013 | $1,900 | $29,400 | $4,690 | $24,710 |
Source: Public Records
Map
Nearby Homes