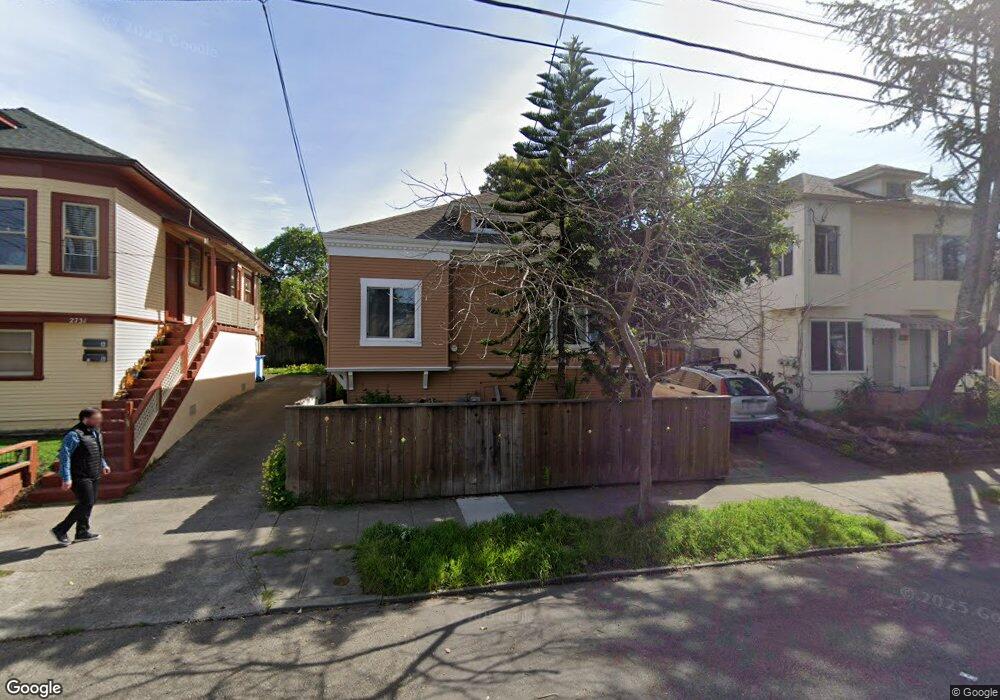
2733 Grant St Berkeley, CA 94703
South Berkeley NeighborhoodEstimated Value: $1,034,000 - $1,554,000
2
Beds
1
Bath
1,180
Sq Ft
$1,040/Sq Ft
Est. Value
About This Home
This home is located at 2733 Grant St, Berkeley, CA 94703 and is currently estimated at $1,227,018, approximately $1,039 per square foot. 2733 Grant St is a home located in Alameda County with nearby schools including Malcolm X Elementary School, Emerson Elementary School, and John Muir Elementary School.
Ownership History
Date
Name
Owned For
Owner Type
Purchase Details
Closed on
Dec 6, 2010
Sold by
Powers Richard T and Powers Richard T
Bought by
Powers Tracey H
Current Estimated Value
Home Financials for this Owner
Home Financials are based on the most recent Mortgage that was taken out on this home.
Original Mortgage
$168,200
Interest Rate
4.18%
Mortgage Type
New Conventional
Purchase Details
Closed on
Mar 12, 2007
Sold by
Powers Tracey and Thomas Tracey
Bought by
Powers Richard T and Powers Tracey H
Purchase Details
Closed on
Feb 27, 2001
Sold by
Curry*Marsh
Bought by
Thomas Tracey
Home Financials for this Owner
Home Financials are based on the most recent Mortgage that was taken out on this home.
Original Mortgage
$275,000
Interest Rate
6.98%
Purchase Details
Closed on
May 15, 2000
Sold by
Henigan James and Estate Of Annie Bell Burton
Bought by
Curry Marsh
Home Financials for this Owner
Home Financials are based on the most recent Mortgage that was taken out on this home.
Original Mortgage
$295,895
Interest Rate
8.22%
Create a Home Valuation Report for This Property
The Home Valuation Report is an in-depth analysis detailing your home's value as well as a comparison with similar homes in the area
Home Values in the Area
Average Home Value in this Area
Purchase History
| Date | Buyer | Sale Price | Title Company |
|---|---|---|---|
| Powers Tracey H | -- | First American Title Company | |
| Powers Richard T | -- | None Available | |
| Thomas Tracey | $475,000 | Old Republic Title Company | |
| Curry Marsh | $300,000 | Old Republic Title Company |
Source: Public Records
Mortgage History
| Date | Status | Borrower | Loan Amount |
|---|---|---|---|
| Closed | Powers Tracey H | $168,200 | |
| Closed | Thomas Tracey | $275,000 | |
| Previous Owner | Curry Marsh | $295,895 |
Source: Public Records
Tax History
| Year | Tax Paid | Tax Assessment Tax Assessment Total Assessment is a certain percentage of the fair market value that is determined by local assessors to be the total taxable value of land and additions on the property. | Land | Improvement |
|---|---|---|---|---|
| 2025 | $10,736 | $715,696 | $214,709 | $500,987 |
| 2024 | $10,736 | $701,664 | $210,499 | $491,165 |
| 2023 | $10,517 | $687,908 | $206,372 | $481,536 |
| 2022 | $10,337 | $674,423 | $202,327 | $472,096 |
| 2021 | $10,365 | $661,200 | $198,360 | $462,840 |
| 2020 | $9,837 | $654,421 | $196,326 | $458,095 |
| 2019 | $9,480 | $641,591 | $192,477 | $449,114 |
| 2018 | $9,327 | $629,013 | $188,704 | $440,309 |
| 2017 | $8,992 | $616,682 | $185,004 | $431,678 |
| 2016 | $8,722 | $604,593 | $181,378 | $423,215 |
| 2015 | $8,610 | $595,516 | $178,655 | $416,861 |
| 2014 | $8,558 | $583,855 | $175,156 | $408,699 |
Source: Public Records
Map
Nearby Homes
- 2701 Grant St
- 1819 Carleton St
- 1726 Parker St Unit 2
- 1726 Parker St Unit 1
- 1901 Parker St Unit 3
- 2533 Grant St
- 2926 Ellis St
- 2829 California St
- 1634 Blake St
- 1612 Parker St
- 2918 Newbury St
- 2123 Oregon St
- 1515 Derby St
- 3033 Ellis St Unit B
- 2057 Emerson St
- 1604 Dwight Way
- 2750 Sacramento St
- 2758 Sacramento St
- 2774 Sacramento St
- 2782 Sacramento St
Your Personal Tour Guide
Ask me questions while you tour the home.