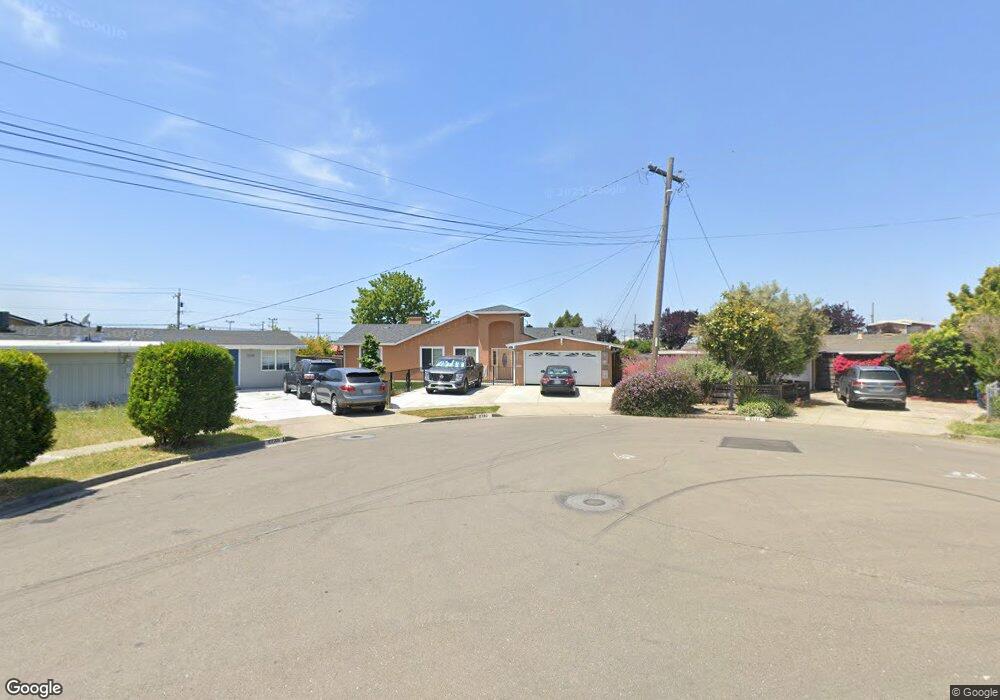
2733 Ocala St Hayward, CA 94545
Glen Eden NeighborhoodEstimated Value: $861,000 - $1,064,931
4
Beds
3
Baths
2,053
Sq Ft
$458/Sq Ft
Est. Value
About This Home
This home is located at 2733 Ocala St, Hayward, CA 94545 and is currently estimated at $939,733, approximately $457 per square foot. 2733 Ocala St is a home located in Alameda County with nearby schools including Lorin A. Eden Elementary School, Anthony W. Ochoa Middle School, and Mt. Eden High School.
Ownership History
Date
Name
Owned For
Owner Type
Purchase Details
Closed on
Apr 23, 1994
Sold by
Reitz Norman E
Bought by
Maharaj Arvind N and Maharaj Sashi L
Current Estimated Value
Home Financials for this Owner
Home Financials are based on the most recent Mortgage that was taken out on this home.
Original Mortgage
$114,000
Interest Rate
4.25%
Create a Home Valuation Report for This Property
The Home Valuation Report is an in-depth analysis detailing your home's value as well as a comparison with similar homes in the area
Home Values in the Area
Average Home Value in this Area
Purchase History
| Date | Buyer | Sale Price | Title Company |
|---|---|---|---|
| Maharaj Arvind N | $120,000 | North American Title Co Inc |
Source: Public Records
Mortgage History
| Date | Status | Borrower | Loan Amount |
|---|---|---|---|
| Closed | Maharaj Arvind N | $114,000 |
Source: Public Records
Tax History Compared to Growth
Tax History
| Year | Tax Paid | Tax Assessment Tax Assessment Total Assessment is a certain percentage of the fair market value that is determined by local assessors to be the total taxable value of land and additions on the property. | Land | Improvement |
|---|---|---|---|---|
| 2025 | $4,849 | $385,142 | $61,185 | $323,957 |
| 2024 | $4,849 | $377,593 | $59,986 | $317,607 |
| 2023 | $4,779 | $370,189 | $58,809 | $311,380 |
| 2022 | $4,688 | $362,932 | $57,656 | $305,276 |
| 2021 | $4,650 | $355,816 | $56,526 | $299,290 |
| 2020 | $4,600 | $352,168 | $55,946 | $296,222 |
| 2019 | $4,637 | $345,264 | $54,849 | $290,415 |
| 2018 | $4,358 | $338,496 | $53,774 | $284,722 |
| 2017 | $4,260 | $331,862 | $52,720 | $279,142 |
| 2016 | $4,012 | $325,357 | $51,687 | $273,670 |
| 2015 | $3,934 | $320,470 | $50,910 | $269,560 |
| 2014 | $3,741 | $314,194 | $49,913 | $264,281 |
Source: Public Records
Map
Nearby Homes
- 2710 Ocala St
- 27553 Portsmouth Ave
- 27342 Capri Ave
- 27568 Capri Ave
- 2617 Naples St
- 2675 Leeward St
- 27459 Ponderosa Ct
- 2452 Oliver Dr
- 27801 Del Norte Ct
- 27949 Pueblo Serena Unit 78
- 27726 Del Norte Ct
- 2421 Arf Ave
- 26142 Gettysburg Ave
- 26147 Stryker St
- 2380 Cabrillo Dr
- 26754 Contessa St
- 2168 Keys Place
- 27493 Orlando Ave
- 2553 Phelan Ave
- 2072 Everglade St
- 2727 Ocala St
- 2739 Ocala St
- 27404 Portsmouth Ave
- 27412 Portsmouth Ave
- 27420 Portsmouth Ave
- 2745 Ocala St
- 2721 Ocala St
- 27432 Portsmouth Ave
- 2715 Ocala St
- 2751 Ocala St
- 2770 Naples St
- 2760 Naples St
- 2780 Naples St
- 2746 Ocala St
- 27446 Portsmouth Ave
- 2750 Naples St
- 2790 Naples St
- 2709 Ocala St
- 2752 Ocala St
- 2763 Ocala St