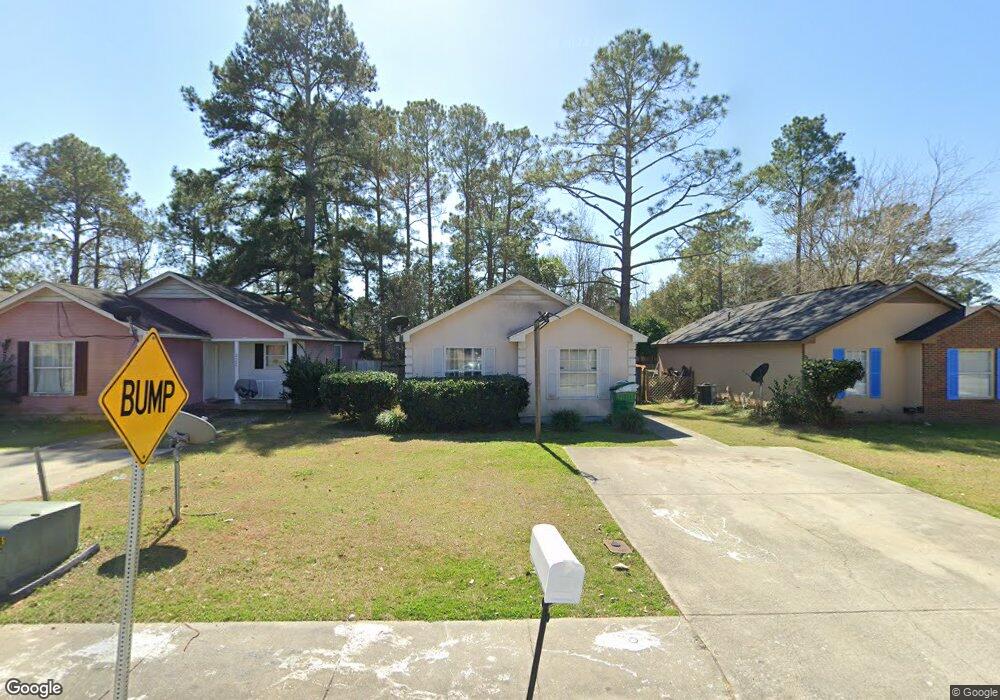
2733 Tyndall Dr Valdosta, GA 31602
Estimated Value: $140,000 - $162,000
4
Beds
2
Baths
1,560
Sq Ft
$96/Sq Ft
Est. Value
About This Home
This home is located at 2733 Tyndall Dr, Valdosta, GA 31602 and is currently estimated at $149,263, approximately $95 per square foot. 2733 Tyndall Dr is a home located in Lowndes County with nearby schools including W.G. Nunn Elementary School, Newbern Middle School, and Valdosta High School.
Ownership History
Date
Name
Owned For
Owner Type
Purchase Details
Closed on
Dec 24, 2010
Sold by
Neal Cynthia
Bought by
Neal Properties & Rentals Llc
Current Estimated Value
Purchase Details
Closed on
Nov 29, 2010
Sold by
Us Federal Credit Union
Bought by
Neal Cynthia
Purchase Details
Closed on
Jun 1, 2010
Sold by
Scharetg Lisa Wallis
Bought by
Us Federal Credit Union
Purchase Details
Closed on
May 5, 2005
Sold by
Little Lindsey Michael
Bought by
Scharetg Lisa Wallis
Home Financials for this Owner
Home Financials are based on the most recent Mortgage that was taken out on this home.
Original Mortgage
$82,500
Interest Rate
5%
Mortgage Type
New Conventional
Purchase Details
Closed on
Mar 12, 1993
Bought by
Little Lindsey Michael
Purchase Details
Closed on
Jan 6, 1992
Bought by
D & B Construction Co
Create a Home Valuation Report for This Property
The Home Valuation Report is an in-depth analysis detailing your home's value as well as a comparison with similar homes in the area
Home Values in the Area
Average Home Value in this Area
Purchase History
| Date | Buyer | Sale Price | Title Company |
|---|---|---|---|
| Neal Properties & Rentals Llc | -- | -- | |
| Neal Cynthia | $56,500 | -- | |
| Us Federal Credit Union | $85,200 | -- | |
| Us Federal Credit Union | $85,248 | -- | |
| Scharetg Lisa Wallis | $82,500 | -- | |
| Little Lindsey Michael | $57,900 | -- | |
| D & B Construction Co | $7,500 | -- |
Source: Public Records
Mortgage History
| Date | Status | Borrower | Loan Amount |
|---|---|---|---|
| Previous Owner | Scharetg Lisa Wallis | $82,500 |
Source: Public Records
Tax History Compared to Growth
Tax History
| Year | Tax Paid | Tax Assessment Tax Assessment Total Assessment is a certain percentage of the fair market value that is determined by local assessors to be the total taxable value of land and additions on the property. | Land | Improvement |
|---|---|---|---|---|
| 2024 | $1,104 | $39,518 | $2,400 | $37,118 |
| 2023 | $1,104 | $39,518 | $2,400 | $37,118 |
| 2022 | $935 | $27,663 | $2,400 | $25,263 |
| 2021 | $978 | $28,126 | $2,400 | $25,726 |
| 2020 | $999 | $28,126 | $2,400 | $25,726 |
| 2019 | $998 | $28,126 | $2,400 | $25,726 |
| 2018 | $1,011 | $28,126 | $2,400 | $25,726 |
| 2017 | $1,018 | $28,126 | $2,400 | $25,726 |
| 2016 | $1,017 | $28,126 | $2,400 | $25,726 |
| 2015 | $933 | $28,126 | $2,400 | $25,726 |
| 2014 | $969 | $28,726 | $3,000 | $25,726 |
Source: Public Records
Map
Nearby Homes
- 1703 Largo Cir
- 11 Crestwood Cir
- 1647 Fresno St
- 7.63 AC Tyndall Dr
- 2019 Fallingleaf Ln
- 2835 Kirkwood Cir
- 1 Pomona Cir
- 2517 Deborah Dr
- 2745 Pineview Dr
- 2713 Pineview Dr Unit A&B
- 1724 Eli Place
- TBD Jaycee Shack Rd
- 2414 Deborah Dr
- 3122 Tyndall Dr
- 1852 Chestnut Dr
- 1739 Eli Place
- 3016 Ginny Dr
- 3200 Tyndall Dr Unit A/B
- 1761 Hyssop Crossing
- 0 Northside Dr Unit 145194
- 2735 Tyndall Dr
- 2731 Tyndall Dr
- 2729 Tyndall Dr
- 2737 Tyndall Dr
- 2739 Tyndall Dr
- 1802 Northside Dr
- 2727 Tyndall Dr
- 1804 Northside Dr
- 2741 Tyndall Dr
- 2748 Tyndall Dr
- 2748 Tyndall Dr Unit 4
- 1806 Northside Dr
- 2744 Tyndall Dr
- 2701 Tyndall Dr
- 2701 Tyndall Dr Unit A&B
- 2750 Tyndall Dr
- 2746 Tyndall Dr
- 2742 Tyndall Dr
- 2743 Tyndall Dr
- 2752 Tyndall Dr