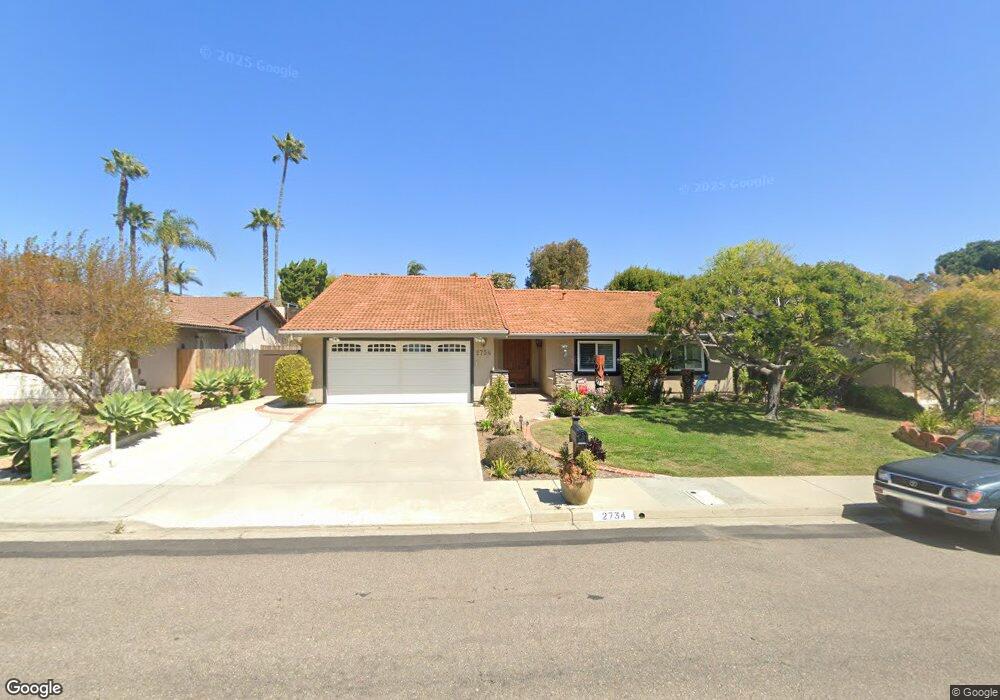
2734 Levante St Carlsbad, CA 92009
La Costa NeighborhoodEstimated Value: $1,575,000 - $1,814,000
3
Beds
2
Baths
2,247
Sq Ft
$741/Sq Ft
Est. Value
About This Home
This home is located at 2734 Levante St, Carlsbad, CA 92009 and is currently estimated at $1,664,502, approximately $740 per square foot. 2734 Levante St is a home located in San Diego County with nearby schools including La Costa Heights Elementary School, Oak Crest Middle School, and La Costa Canyon High School.
Ownership History
Date
Name
Owned For
Owner Type
Purchase Details
Closed on
Sep 28, 2017
Sold by
Gamboa Tracee and Desi Gamboa R
Bought by
Gamboa Gamboa R and Gamboa Tracee
Current Estimated Value
Purchase Details
Closed on
Aug 24, 2005
Sold by
Gamboa R Desi and Gamboa Tracee
Bought by
Gamboa R Desi and Gamboa Tracee
Home Financials for this Owner
Home Financials are based on the most recent Mortgage that was taken out on this home.
Original Mortgage
$200,000
Interest Rate
5.64%
Mortgage Type
Credit Line Revolving
Purchase Details
Closed on
Jun 17, 1998
Sold by
Molineaux Joseph F and Molineaux Sandra L
Bought by
Gamboa R Desi and Gamboa Tracee
Home Financials for this Owner
Home Financials are based on the most recent Mortgage that was taken out on this home.
Original Mortgage
$219,200
Interest Rate
7%
Create a Home Valuation Report for This Property
The Home Valuation Report is an in-depth analysis detailing your home's value as well as a comparison with similar homes in the area
Home Values in the Area
Average Home Value in this Area
Purchase History
| Date | Buyer | Sale Price | Title Company |
|---|---|---|---|
| Gamboa Gamboa R | -- | None Available | |
| Gamboa R Desi | -- | Commonwealth Title | |
| Gamboa R Desi | $274,000 | First American Title |
Source: Public Records
Mortgage History
| Date | Status | Borrower | Loan Amount |
|---|---|---|---|
| Closed | Gamboa R Desi | $200,000 | |
| Closed | Gamboa R Desi | $219,200 |
Source: Public Records
Tax History
| Year | Tax Paid | Tax Assessment Tax Assessment Total Assessment is a certain percentage of the fair market value that is determined by local assessors to be the total taxable value of land and additions on the property. | Land | Improvement |
|---|---|---|---|---|
| 2025 | $5,772 | $500,188 | $143,779 | $356,409 |
| 2024 | $5,772 | $490,381 | $140,960 | $349,421 |
| 2023 | $5,593 | $480,767 | $138,197 | $342,570 |
| 2022 | $5,450 | $471,341 | $135,488 | $335,853 |
| 2021 | $5,350 | $462,100 | $132,832 | $329,268 |
| 2020 | $5,255 | $457,362 | $131,470 | $325,892 |
| 2019 | $5,153 | $448,395 | $128,893 | $319,502 |
| 2018 | $5,071 | $439,604 | $126,366 | $313,238 |
| 2017 | $4,986 | $430,986 | $123,889 | $307,097 |
| 2016 | $4,838 | $422,536 | $121,460 | $301,076 |
| 2015 | $4,744 | $416,190 | $119,636 | $296,554 |
| 2014 | $4,628 | $408,038 | $117,293 | $290,745 |
Source: Public Records
Map
Nearby Homes
- 2644 La Costa Ave
- 2606 Galicia Way
- 2904 Levante St
- 7570 Gibraltar St Unit 101
- 2639 Pirineos Way Unit 234
- 2607 Pirineos Way Unit 116
- 2712 Mateo Place
- 2630 Pirineos Way Unit 4
- 7559 Gibraltar St Unit 16
- 2537 Navarra Dr Unit 9B
- 2940 Gaviota Cir
- 2544 Navarra Dr Unit 12
- 2414 Sacada Cir
- 2564 Navarra Dr Unit 115
- 2556 Navarra Dr Unit A
- 2508 Navarra Dr Unit 424
- 2508 Navarra Dr Unit 423
- 2297 Levante St
- 2204 Recodo Ct
- 2403 La Costa Ave Unit A
- 2744 Levante St
- 2724 Levante St
- 2731 Galicia Way
- 2741 Galicia Way
- 2754 Levante St
- 2714 Levante St
- 2725 Galicia Way
- 2753 Galicia Way
- 2733 Levante St
- 2723 Levante St
- 2743 Levante St
- 2721 Galicia Way
- 2704 Levante St
- 2765 Galicia Way
- 2753 Levante St
- 2703 Levante St
- 2711 Galicia Way
- 2774 Levante St
- 2736 Galicia Way
- 2732 La Gran Viaduct
Your Personal Tour Guide
Ask me questions while you tour the home.