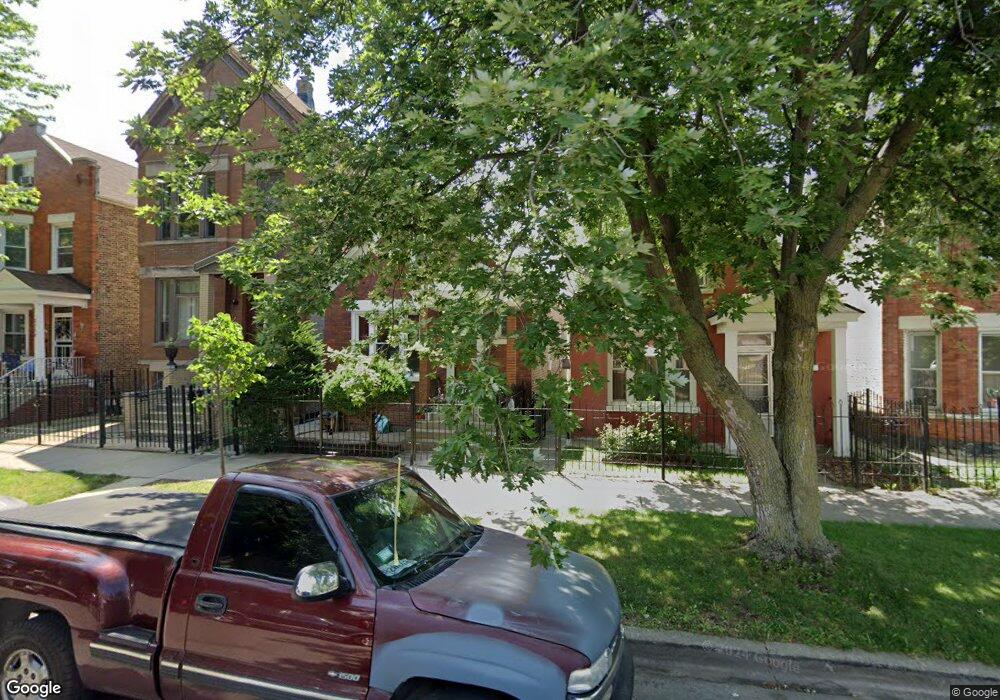
2734 S Ridgeway Ave Chicago, IL 60623
Little Village NeighborhoodEstimated Value: $236,000 - $261,000
5
Beds
2
Baths
1,315
Sq Ft
$190/Sq Ft
Est. Value
About This Home
This home is located at 2734 S Ridgeway Ave, Chicago, IL 60623 and is currently estimated at $249,918, approximately $190 per square foot. 2734 S Ridgeway Ave is a home located in Cook County with nearby schools including Gary Elementary School, Ortiz De Dominguez Elementary School, and St. Agnes of Bohemia School.
Ownership History
Date
Name
Owned For
Owner Type
Purchase Details
Closed on
Feb 5, 2007
Sold by
Garcia Paula
Bought by
Garcia Paula and Gomez Alejandro
Current Estimated Value
Home Financials for this Owner
Home Financials are based on the most recent Mortgage that was taken out on this home.
Original Mortgage
$161,250
Outstanding Balance
$19,336
Interest Rate
6.4%
Mortgage Type
New Conventional
Estimated Equity
$230,582
Purchase Details
Closed on
Jan 31, 2005
Sold by
Alvarez Irma
Bought by
Garcia Paula
Home Financials for this Owner
Home Financials are based on the most recent Mortgage that was taken out on this home.
Original Mortgage
$155,700
Interest Rate
7.7%
Mortgage Type
Unknown
Purchase Details
Closed on
Nov 30, 1993
Sold by
Diaz Luis and Diaz Rosalina
Bought by
Alvarez Irma
Home Financials for this Owner
Home Financials are based on the most recent Mortgage that was taken out on this home.
Original Mortgage
$26,500
Interest Rate
6.95%
Create a Home Valuation Report for This Property
The Home Valuation Report is an in-depth analysis detailing your home's value as well as a comparison with similar homes in the area
Home Values in the Area
Average Home Value in this Area
Purchase History
| Date | Buyer | Sale Price | Title Company |
|---|---|---|---|
| Garcia Paula | -- | None Available | |
| Garcia Paula | $173,000 | Stewart Title Of Illinois | |
| Alvarez Irma | $51,000 | -- |
Source: Public Records
Mortgage History
| Date | Status | Borrower | Loan Amount |
|---|---|---|---|
| Open | Garcia Paula | $161,250 | |
| Closed | Garcia Paula | $155,700 | |
| Previous Owner | Alvarez Irma | $26,500 |
Source: Public Records
Tax History Compared to Growth
Tax History
| Year | Tax Paid | Tax Assessment Tax Assessment Total Assessment is a certain percentage of the fair market value that is determined by local assessors to be the total taxable value of land and additions on the property. | Land | Improvement |
|---|---|---|---|---|
| 2024 | $3,376 | $23,000 | $4,350 | $18,650 |
| 2023 | $3,291 | $16,000 | $3,525 | $12,475 |
| 2022 | $3,291 | $16,000 | $3,525 | $12,475 |
| 2021 | $3,217 | $16,000 | $3,525 | $12,475 |
| 2020 | $3,186 | $14,301 | $3,525 | $10,776 |
| 2019 | $3,265 | $16,252 | $3,525 | $12,727 |
| 2018 | $3,210 | $16,252 | $3,525 | $12,727 |
| 2017 | $3,474 | $16,136 | $3,150 | $12,986 |
| 2016 | $3,232 | $16,136 | $3,150 | $12,986 |
| 2015 | $2,957 | $16,136 | $3,150 | $12,986 |
| 2014 | $2,772 | $14,941 | $3,000 | $11,941 |
| 2013 | $2,717 | $14,941 | $3,000 | $11,941 |
Source: Public Records
Map
Nearby Homes
- 2711 S Hamlin Ave
- 2807 S Hamlin Ave
- 2632 S Millard Ave
- 3028 S Millard Ave
- 2536 S Avers Ave
- 2632 S Drake Ave
- 2541 S Springfield Ave
- 2800 S Saint Louis Ave
- 1808 S Hamlin Ave
- 2458 S Pulaski Rd
- 2652 S Komensky Ave
- 2817 S Trumbull Ave
- 2841 S Trumbull Ave
- 2802 S Homan Ave
- 2757 S Homan Ave
- 2352 S Lawndale Ave
- 2436 S Pulaski Rd
- 3854 W 24th St
- 2845 S Kedvale Ave
- 2434 S Pulaski Rd
- 2732 S Ridgeway Ave
- 2730 S Ridgeway Ave
- 2728 S Ridgeway Ave
- 2726 S Ridgeway Ave
- 2736 S Ridgeway Ave Unit 1
- 2738 S Ridgeway Ave
- 2724 S Ridgeway Ave
- 2724 S Ridgeway Ave
- 2720 S Ridgeway Ave
- 2744 S Ridgeway Ave
- 2731 S Hamlin Ave Unit 1
- 2746 S Ridgeway Ave
- 2716 S Ridgeway Ave
- 2729 S Hamlin Ave
- 2725 S Hamlin Ave
- 2739 S Hamlin Ave
- 2714 S Ridgeway Ave
- 2735 S Hamlin Ave
- 2748 S Ridgeway Ave
- 2725 S Ridgeway Ave Unit 12