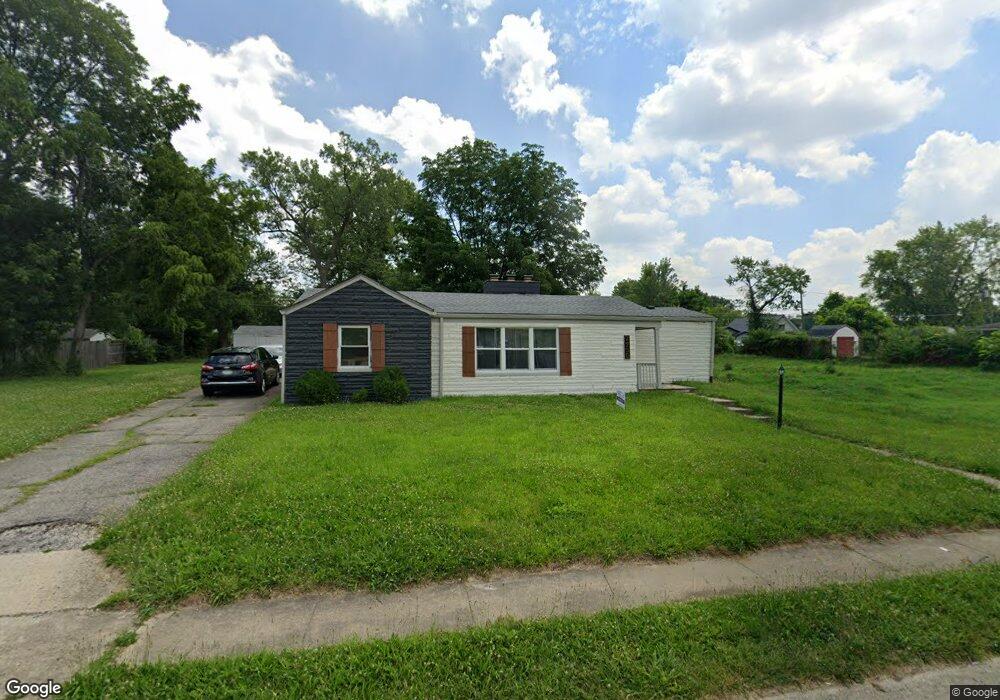
2735 Wheeler St Indianapolis, IN 46218
Martindale-Brightwood NeighborhoodEstimated Value: $147,000 - $163,000
3
Beds
1
Bath
1,242
Sq Ft
$125/Sq Ft
Est. Value
About This Home
This home is located at 2735 Wheeler St, Indianapolis, IN 46218 and is currently estimated at $155,289, approximately $125 per square foot. 2735 Wheeler St is a home located in Marion County with nearby schools including Arlington Woods Elementary School No. 99, Thomas D. Gregg School No. 15, and Washington Irving School 14.
Ownership History
Date
Name
Owned For
Owner Type
Purchase Details
Closed on
Mar 11, 2021
Sold by
Hodges Brian D and Hodges Kelly E
Bought by
Hodges Brian D and Hodges Kelly E
Current Estimated Value
Purchase Details
Closed on
Oct 2, 2020
Sold by
Hodges David T and Hodges Kelly E
Bought by
Hodges Brian D and Hodges Kelly E
Purchase Details
Closed on
Oct 3, 2019
Sold by
Hodges Realty Llc
Bought by
Hodges David T and Hodges Kelly E
Purchase Details
Closed on
Feb 11, 2015
Sold by
Hodges Brian D
Bought by
Hodges David T and Hodges Realty Llc
Purchase Details
Closed on
Feb 17, 2012
Sold by
Marion County Board Of Commissioners Cit
Bought by
Hodges David Thomas and Hodges Brian David
Purchase Details
Closed on
Feb 16, 2012
Sold by
South Point Inc
Bought by
County Of Marion
Purchase Details
Closed on
Aug 28, 2006
Sold by
Hodges Manada
Bought by
South Point Inc
Create a Home Valuation Report for This Property
The Home Valuation Report is an in-depth analysis detailing your home's value as well as a comparison with similar homes in the area
Home Values in the Area
Average Home Value in this Area
Purchase History
| Date | Buyer | Sale Price | Title Company |
|---|---|---|---|
| Hodges Brian D | -- | None Available | |
| Hodges Brian D | -- | None Available | |
| Hodges David T | -- | None Available | |
| Hodges David T | -- | None Available | |
| Hodges David Thomas | $500 | None Available | |
| County Of Marion | $3,004 | None Available | |
| South Point Inc | -- | None Available |
Source: Public Records
Tax History Compared to Growth
Tax History
| Year | Tax Paid | Tax Assessment Tax Assessment Total Assessment is a certain percentage of the fair market value that is determined by local assessors to be the total taxable value of land and additions on the property. | Land | Improvement |
|---|---|---|---|---|
| 2024 | $2,355 | $102,700 | $17,000 | $85,700 |
| 2023 | $2,355 | $94,800 | $17,000 | $77,800 |
| 2022 | $2,330 | $94,300 | $17,000 | $77,300 |
| 2021 | $1,701 | $70,700 | $17,000 | $53,700 |
| 2020 | $1,626 | $67,300 | $5,400 | $61,900 |
| 2019 | $1,517 | $61,500 | $5,400 | $56,100 |
| 2018 | $1,423 | $57,100 | $5,400 | $51,700 |
| 2017 | $1,362 | $61,300 | $5,400 | $55,900 |
| 2016 | $1,331 | $61,300 | $5,400 | $55,900 |
| 2014 | $1,291 | $59,700 | $5,400 | $54,300 |
| 2013 | $1,185 | $57,000 | $2,700 | $54,300 |
Source: Public Records
Map
Nearby Homes
- 3320 E 26th St
- 2369 N Oxford St
- 2740 N Rural St
- 2719 E 28th St
- 2818 Stuart St
- 3201 Adams St
- 2718 N Olney St
- 2870 Stuart St
- 2410 Adams St
- 2614 N Olney St
- 2965 N Olney St
- 2842 N Olney St
- 3350 N Olney St
- 2373 N Oxford St
- 2834 Eastern Ave
- 2430 Stuart St
- 2349 N Lasalle St
- 3305 E 30th St
- 2332 N Parker Ave
- 2341 N Rural St
- 2739 Wheeler St
- 2734 N Dearborn St
- 2713 Wheeler St
- 2736 N Dearborn St
- 2728 N Dearborn St
- 2738 N Dearborn St
- 2724 Wheeler St
- 2730 Wheeler St
- 2718 Wheeler St
- 2742 N Dearborn St
- 2720 N Dearborn St
- 2736 Wheeler St
- 2718 N Dearborn St
- 2712 Wheeler St
- 2801 Wheeler St
- 2710 N Dearborn St
- 2802 N Dearborn St
- 2747 N Dearborn St
- 2701 Wheeler St
- 2708 N Dearborn St