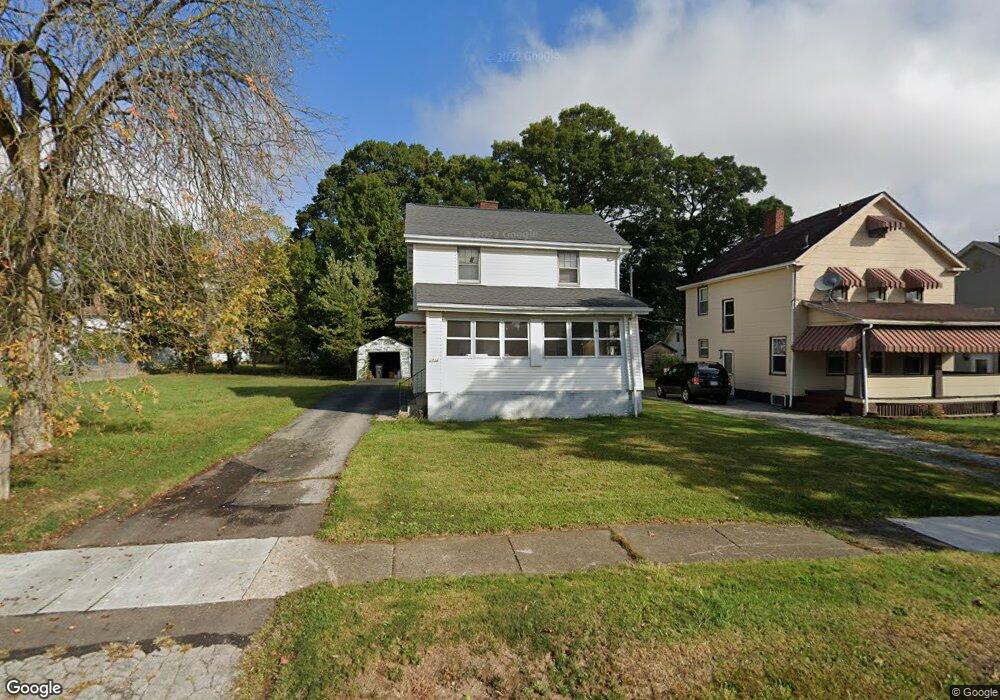
2736 E Midlothian Blvd Youngstown, OH 44502
Buckeye Plat NeighborhoodEstimated Value: $48,000 - $63,000
2
Beds
1
Bath
960
Sq Ft
$62/Sq Ft
Est. Value
About This Home
This home is located at 2736 E Midlothian Blvd, Youngstown, OH 44502 and is currently estimated at $59,064, approximately $61 per square foot. 2736 E Midlothian Blvd is a home located in Mahoning County with nearby schools including Paul C. Bunn Elementary School, Chaney High School, and Summit Academy Secondary School - Youngstown.
Ownership History
Date
Name
Owned For
Owner Type
Purchase Details
Closed on
Oct 10, 2022
Sold by
Thomas Douglas E
Bought by
D Thomas Properties Llc
Current Estimated Value
Purchase Details
Closed on
Jun 24, 2022
Bought by
Thomas Douglas E
Purchase Details
Closed on
Jun 8, 2022
Sold by
Roman Christopher
Bought by
Thomas Douglas E
Purchase Details
Closed on
Oct 7, 2003
Sold by
Colonna Richard and Colonna Cynthia
Bought by
Grover Amy C
Home Financials for this Owner
Home Financials are based on the most recent Mortgage that was taken out on this home.
Original Mortgage
$36,000
Interest Rate
6.02%
Mortgage Type
Purchase Money Mortgage
Purchase Details
Closed on
May 28, 1999
Sold by
Fagan Rose Ann
Bought by
Colonna Richard and Colonna Cynthia
Purchase Details
Closed on
Feb 22, 1999
Bought by
Amy C Grover
Purchase Details
Closed on
Jan 1, 1990
Bought by
Fagan Rose Ann
Create a Home Valuation Report for This Property
The Home Valuation Report is an in-depth analysis detailing your home's value as well as a comparison with similar homes in the area
Home Values in the Area
Average Home Value in this Area
Purchase History
| Date | Buyer | Sale Price | Title Company |
|---|---|---|---|
| D Thomas Properties Llc | -- | None Listed On Document | |
| Thomas Douglas E | $34,811 | -- | |
| Thomas Douglas E | $34,811 | None Listed On Document | |
| Grover Amy C | $37,900 | -- | |
| Colonna Richard | $16,000 | -- | |
| Amy C Grover | -- | -- | |
| Fagan Rose Ann | -- | -- |
Source: Public Records
Mortgage History
| Date | Status | Borrower | Loan Amount |
|---|---|---|---|
| Previous Owner | Grover Amy C | $36,000 |
Source: Public Records
Tax History
| Year | Tax Paid | Tax Assessment Tax Assessment Total Assessment is a certain percentage of the fair market value that is determined by local assessors to be the total taxable value of land and additions on the property. | Land | Improvement |
|---|---|---|---|---|
| 2025 | $405 | $9,350 | $980 | $8,370 |
| 2024 | $459 | $9,350 | $980 | $8,370 |
| 2023 | $456 | $9,350 | $980 | $8,370 |
| 2022 | $260 | $4,190 | $960 | $3,230 |
| 2021 | $260 | $4,190 | $960 | $3,230 |
| 2020 | $261 | $4,190 | $960 | $3,230 |
| 2019 | $267 | $3,810 | $870 | $2,940 |
| 2018 | $270 | $3,810 | $870 | $2,940 |
| 2017 | $267 | $3,810 | $870 | $2,940 |
| 2016 | $392 | $6,050 | $870 | $5,180 |
| 2015 | $384 | $6,050 | $870 | $5,180 |
| 2014 | $381 | $6,050 | $870 | $5,180 |
| 2013 | $376 | $6,050 | $870 | $5,180 |
Source: Public Records
Map
Nearby Homes
- 447 8th St
- 417 9th St
- 3524 Champlain Ave
- 2510 E Midlothian Blvd
- 541 Lincoln St
- 3516 Champlain Ave
- 537 7th St
- 414 10th St
- 464 Elm St
- 0 Crescent Dr Unit 5124984
- 457 Sexton St
- 227 Maplewood Ave
- 281 Sexton St
- 610 Elm St
- 265 Sexton St
- 3803 Loveland Rd
- 252 State St
- 612 Maplewood Ave
- 2025 Pointview Ave
- 2016 Pointview Ave
- 2740 E Midlothian Blvd
- 2730 E Midlothian Blvd
- 2726 E Midlothian Blvd
- 2744 E Midlothian Blvd
- 2733 Mount Vernon Ave
- 2720 E Midlothian Blvd
- 2750 E Midlothian Blvd
- 2729 Mount Vernon Ave
- 2739 Mount Vernon Ave
- 2729 E Midlothian Blvd
- 2725 Mount Vernon Ave
- 2743 E Midlothian Blvd
- 2716 E Midlothian Blvd
- 2754 E Midlothian Blvd
- 2747 Mount Vernon Ave
- 2719 Mount Vernon Ave
- 2741 E Midlothian Blvd
- 400 7th St
- 2725 E Midlothian Blvd
- 2715 Mount Vernon Ave
Your Personal Tour Guide
Ask me questions while you tour the home.