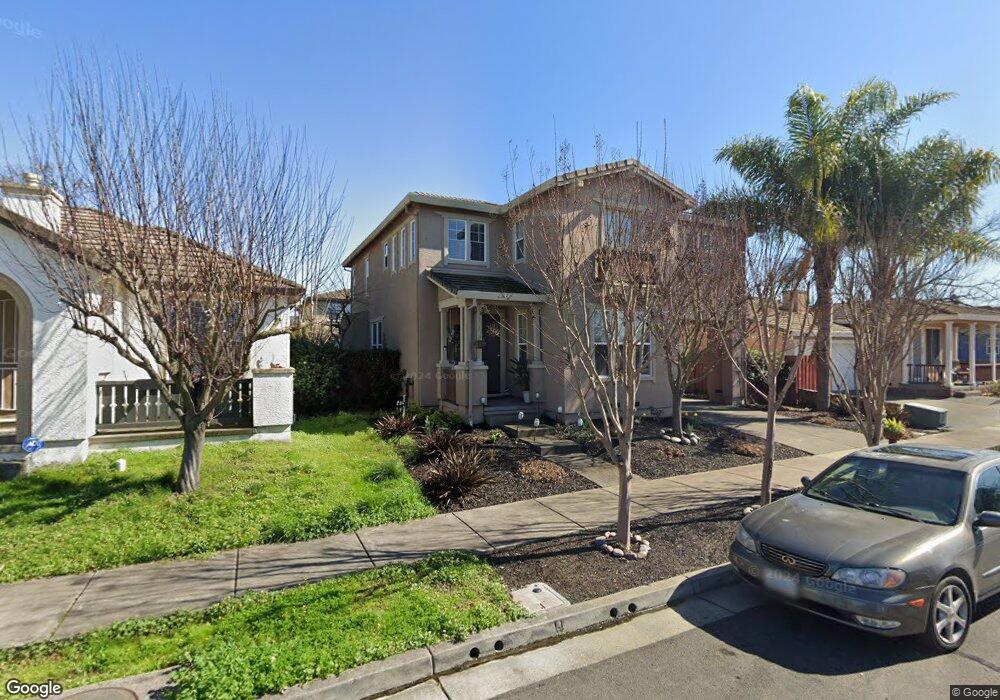
2736 Morgan Creek St Santa Rosa, CA 95407
Estimated Value: $668,000 - $747,000
3
Beds
3
Baths
1,848
Sq Ft
$392/Sq Ft
Est. Value
About This Home
This home is located at 2736 Morgan Creek St, Santa Rosa, CA 95407 and is currently estimated at $724,180, approximately $391 per square foot. 2736 Morgan Creek St is a home located in Sonoma County with nearby schools including Elsie Allen High School and St. Michael's Orthodox School.
Ownership History
Date
Name
Owned For
Owner Type
Purchase Details
Closed on
Nov 9, 2012
Sold by
Romano Crystal S
Bought by
Romano Crystal S and Crystal S Romano 2012 Living T
Current Estimated Value
Purchase Details
Closed on
Jan 22, 2009
Sold by
Todorovitch Jim A and Todorovitch Shelley
Bought by
Romano Crystal
Home Financials for this Owner
Home Financials are based on the most recent Mortgage that was taken out on this home.
Original Mortgage
$295,200
Outstanding Balance
$186,192
Interest Rate
5.14%
Mortgage Type
Purchase Money Mortgage
Estimated Equity
$537,988
Purchase Details
Closed on
Oct 11, 2007
Sold by
Sw Santa Rosa Partners Lp
Bought by
Todorovitch Jim A and Todorovitch Shelley
Home Financials for this Owner
Home Financials are based on the most recent Mortgage that was taken out on this home.
Original Mortgage
$484,800
Interest Rate
5.75%
Mortgage Type
Purchase Money Mortgage
Create a Home Valuation Report for This Property
The Home Valuation Report is an in-depth analysis detailing your home's value as well as a comparison with similar homes in the area
Home Values in the Area
Average Home Value in this Area
Purchase History
| Date | Buyer | Sale Price | Title Company |
|---|---|---|---|
| Romano Crystal S | -- | None Available | |
| Romano Crystal | $328,000 | Fidelity National Title Co | |
| Todorovitch Jim A | $631,181 | Liberty Title Company |
Source: Public Records
Mortgage History
| Date | Status | Borrower | Loan Amount |
|---|---|---|---|
| Open | Romano Crystal | $295,200 | |
| Previous Owner | Todorovitch Jim A | $484,800 |
Source: Public Records
Tax History Compared to Growth
Tax History
| Year | Tax Paid | Tax Assessment Tax Assessment Total Assessment is a certain percentage of the fair market value that is determined by local assessors to be the total taxable value of land and additions on the property. | Land | Improvement |
|---|---|---|---|---|
| 2025 | $4,795 | $422,369 | $64,379 | $357,990 |
| 2024 | $4,795 | $414,088 | $63,117 | $350,971 |
| 2023 | $4,795 | $405,970 | $61,880 | $344,090 |
| 2022 | $4,678 | $398,011 | $60,667 | $337,344 |
| 2021 | $4,627 | $390,208 | $59,478 | $330,730 |
| 2020 | $4,494 | $386,208 | $58,869 | $327,339 |
| 2019 | $4,438 | $378,636 | $57,715 | $320,921 |
| 2018 | $4,401 | $371,213 | $56,584 | $314,629 |
| 2017 | $4,293 | $363,935 | $55,475 | $308,460 |
| 2016 | $4,237 | $356,800 | $54,388 | $302,412 |
| 2015 | $4,102 | $351,442 | $53,572 | $297,870 |
| 2014 | $3,957 | $344,559 | $52,523 | $292,036 |
Source: Public Records
Map
Nearby Homes
- 2599 Silver Spur Dr
- 2632 Wild Bill Way
- 1260 Aloise Ave
- 2630 Arrowhead Dr
- 2727 Victoria Dr
- 2721 Victoria Dr
- 2716 Amora Cir
- 2863 Liscum St
- Plan 2 at Grove Village
- Plan 4 at Grove Village
- Plan 5 at Grove Village
- Plan 1 at Grove Village
- Plan 6 at Grove Village
- 2912 Liscum St
- 2928 Liscum St
- 2931 Liscum St
- 2766 Sassy St
- 2771 Sassy St
- 2778 Sassy St
- 2779 Sassy St
- 2742 Morgan Creek St
- 2730 Morgan Creek St
- 1912 Montevino Dr
- 2735 Dutton Meadow
- 2741 Dutton Meadow
- 2724 Morgan Creek St
- 2729 Dutton Meadow
- 2718 Morgan Creek St
- 1915 Montevino Dr
- 2723 Dutton Meadow
- 1920 Montevino Dr
- 2807 Dutton Meadow
- 1921 Montevino Dr
- 2717 Dutton Meadow
- 1928 Montevino Dr
- 2712 Morgan Creek St
- 1910 Tuxhorn Dr
- 1927 Montevino Dr
- 2786 Dutton Meadow
- 1918 Tuxhorn Dr