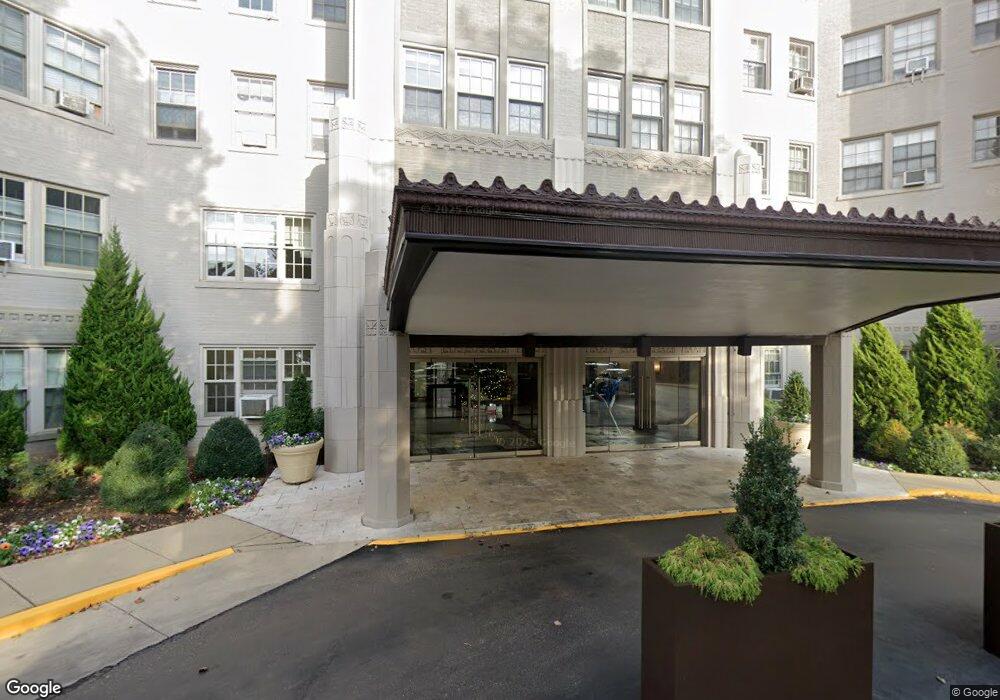
Woodley Park Towers 2737 Devonshire Place NW Unit 12 Washington, DC 20008
Woodley Park NeighborhoodEstimated Value: $482,000 - $579,213
1
Bed
1
Bath
1,127
Sq Ft
$471/Sq Ft
Est. Value
About This Home
This home is located at 2737 Devonshire Place NW Unit 12, Washington, DC 20008 and is currently estimated at $531,303, approximately $471 per square foot. 2737 Devonshire Place NW Unit 12 is a home located in District of Columbia with nearby schools including Eaton Elementary School, Hardy Middle School, and Jackson Reed High School.
Ownership History
Date
Name
Owned For
Owner Type
Purchase Details
Closed on
Feb 21, 2023
Sold by
Karmonick Jennifer Ann
Bought by
Kennedy Ariel Deborah and Lynam Ronan Niall
Current Estimated Value
Home Financials for this Owner
Home Financials are based on the most recent Mortgage that was taken out on this home.
Original Mortgage
$341,250
Outstanding Balance
$327,245
Interest Rate
5%
Mortgage Type
New Conventional
Estimated Equity
$204,058
Purchase Details
Closed on
Sep 27, 2007
Sold by
Sheehy Jennifer
Bought by
Karmonick Jennifer
Home Financials for this Owner
Home Financials are based on the most recent Mortgage that was taken out on this home.
Original Mortgage
$380,000
Interest Rate
6.65%
Mortgage Type
New Conventional
Purchase Details
Closed on
Aug 25, 1998
Sold by
Jennings Gretchen M
Bought by
Sheehy Jennifer C
Home Financials for this Owner
Home Financials are based on the most recent Mortgage that was taken out on this home.
Original Mortgage
$124,000
Interest Rate
6.86%
Mortgage Type
New Conventional
Create a Home Valuation Report for This Property
The Home Valuation Report is an in-depth analysis detailing your home's value as well as a comparison with similar homes in the area
Home Values in the Area
Average Home Value in this Area
Purchase History
| Date | Buyer | Sale Price | Title Company |
|---|---|---|---|
| Kennedy Ariel Deborah | $546,000 | -- | |
| Karmonick Jennifer | $475,000 | -- | |
| Sheehy Jennifer C | $155,000 | -- |
Source: Public Records
Mortgage History
| Date | Status | Borrower | Loan Amount |
|---|---|---|---|
| Open | Kennedy Ariel Deborah | $341,250 | |
| Previous Owner | Karmonick Jennifer | $380,000 | |
| Previous Owner | Sheehy Jennifer C | $124,000 |
Source: Public Records
Tax History Compared to Growth
Tax History
| Year | Tax Paid | Tax Assessment Tax Assessment Total Assessment is a certain percentage of the fair market value that is determined by local assessors to be the total taxable value of land and additions on the property. | Land | Improvement |
|---|---|---|---|---|
| 2025 | $3,629 | $532,400 | $159,720 | $372,680 |
| 2024 | $3,540 | $518,650 | $155,590 | $363,060 |
| 2023 | $3,402 | $498,990 | $149,700 | $349,290 |
| 2022 | $3,468 | $500,490 | $150,150 | $350,340 |
| 2021 | $3,391 | $488,580 | $146,570 | $342,010 |
| 2020 | $3,470 | $483,940 | $145,180 | $338,760 |
| 2019 | $3,528 | $489,920 | $146,980 | $342,940 |
| 2018 | $3,379 | $470,930 | $0 | $0 |
| 2017 | $3,203 | $449,320 | $0 | $0 |
| 2016 | $3,113 | $437,950 | $0 | $0 |
| 2015 | $3,089 | $434,760 | $0 | $0 |
| 2014 | -- | $404,680 | $0 | $0 |
Source: Public Records
About Woodley Park Towers
Map
Nearby Homes
- 2737 Devonshire Place NW Unit 503
- 2737 Devonshire Place NW Unit 418
- 3100 Connecticut Ave NW Unit 419
- 2710 Macomb St NW Unit 204
- 2901 Newark St NW
- 2907 Newark St NW
- 2721 Ordway St NW Unit 5
- 3446 Connecticut Ave NW Unit 305
- 3446 Connecticut Ave NW Unit 401
- 3039 Macomb St NW Unit 17
- 3039 Macomb St NW Unit 3A
- 3101 Highland Place NW
- 2637 Garfield St NW
- 2829 Connecticut Ave NW Unit 107
- 2829 Connecticut Ave NW Unit 512
- 2902 Porter St NW Unit 43
- 2818 Connecticut Ave NW Unit 104
- 3512 30th St NW
- 3600 Connecticut Ave NW Unit 202
- 3600 Connecticut Ave NW Unit 105
- 2737 Devonshire Place NW Unit F
- 2737 Devonshire Place NW Unit C
- 2737 Devonshire Place NW
- 2737 Devonshire Place NW Unit 401
- 2737 Devonshire Place NW Unit 416
- 2737 Devonshire Place NW Unit 428
- 2737 Devonshire Place NW Unit 330
- 2737 Devonshire Place NW Unit 520
- 2737 Devonshire Place NW Unit 119
- 2737 Devonshire Place NW Unit 312
- 2737 Devonshire Place NW Unit 214
- 2737 Devonshire Place NW Unit 529
- 2737 Devonshire Place NW Unit 527
- 2737 Devonshire Place NW Unit 9
- 2737 Devonshire Place NW Unit 120
- 2737 Devonshire Place NW Unit 328
- 2737 Devonshire Place NW Unit 117
- 2737 Devonshire Place NW Unit 204
- 2737 Devonshire Place NW Unit 19
- 2737 Devonshire Place NW Unit 528