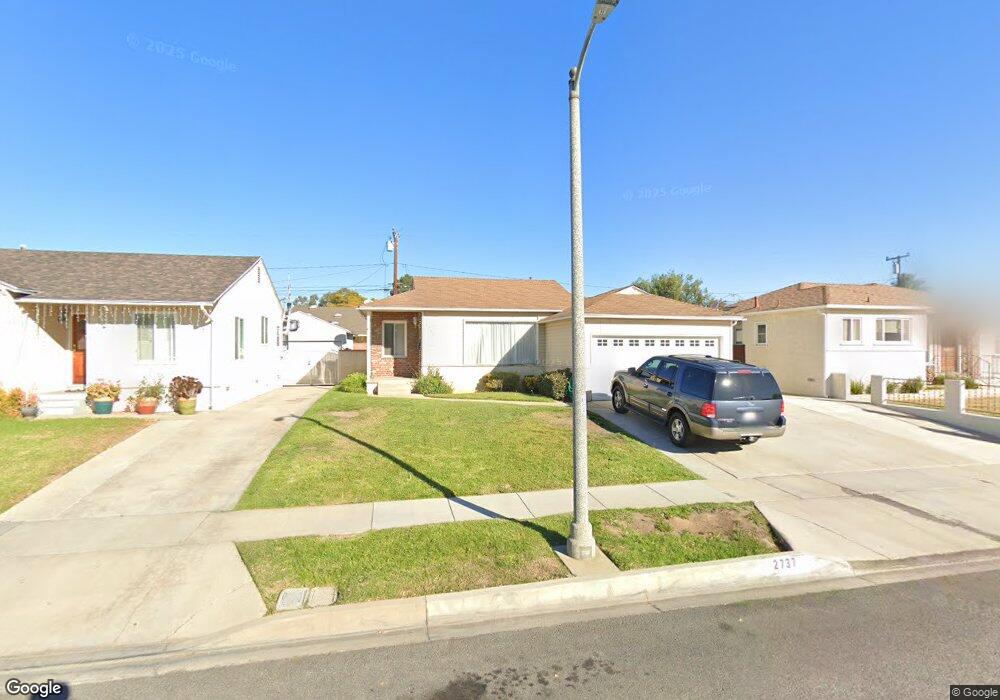
2737 Flangel St Lakewood, CA 90712
Lakewood Mutual NeighborhoodEstimated Value: $825,000 - $906,000
3
Beds
2
Baths
1,519
Sq Ft
$566/Sq Ft
Est. Value
About This Home
This home is located at 2737 Flangel St, Lakewood, CA 90712 and is currently estimated at $860,312, approximately $566 per square foot. 2737 Flangel St is a home located in Los Angeles County with nearby schools including James Madison Elementary School, Hoover Middle School, and Lakewood High School.
Ownership History
Date
Name
Owned For
Owner Type
Purchase Details
Closed on
Dec 12, 2001
Sold by
Abarca Moises B and Abarca Maria G
Bought by
Armijo Phillip M
Current Estimated Value
Home Financials for this Owner
Home Financials are based on the most recent Mortgage that was taken out on this home.
Original Mortgage
$150,000
Interest Rate
6.51%
Purchase Details
Closed on
Mar 16, 1995
Sold by
Derosier David and Derosier Gayle
Bought by
Armijo Phillip M
Create a Home Valuation Report for This Property
The Home Valuation Report is an in-depth analysis detailing your home's value as well as a comparison with similar homes in the area
Home Values in the Area
Average Home Value in this Area
Purchase History
| Date | Buyer | Sale Price | Title Company |
|---|---|---|---|
| Armijo Phillip M | -- | Chicago Title Co | |
| Armijo Phillip M | $185,000 | Continental Lawyers Title Co |
Source: Public Records
Mortgage History
| Date | Status | Borrower | Loan Amount |
|---|---|---|---|
| Previous Owner | Armijo Phillip M | $150,000 |
Source: Public Records
Tax History Compared to Growth
Tax History
| Year | Tax Paid | Tax Assessment Tax Assessment Total Assessment is a certain percentage of the fair market value that is determined by local assessors to be the total taxable value of land and additions on the property. | Land | Improvement |
|---|---|---|---|---|
| 2025 | $4,315 | $310,711 | $177,695 | $133,016 |
| 2024 | $4,315 | $304,619 | $174,211 | $130,408 |
| 2023 | $4,242 | $298,647 | $170,796 | $127,851 |
| 2022 | $3,994 | $292,793 | $167,448 | $125,345 |
| 2021 | $3,909 | $287,053 | $164,165 | $122,888 |
| 2019 | $3,850 | $278,541 | $159,297 | $119,244 |
| 2018 | $3,681 | $273,080 | $156,174 | $116,906 |
| 2016 | $3,385 | $262,477 | $150,110 | $112,367 |
| 2015 | $3,257 | $258,536 | $147,856 | $110,680 |
| 2014 | $3,237 | $253,472 | $144,960 | $108,512 |
Source: Public Records
Map
Nearby Homes
- 2729 Greentop St
- 2803 Frankel St
- 4559 Levelside Ave
- 4328 Deeboyar Ave
- 3244 Centralia St
- 2912 Allred St
- 4700 Clair Del Ave Unit 538
- 2523 Allred St
- 3638 Sandwood St
- 2922 Eckleson St
- 2912 Yearling St
- 4121 Country Club Dr
- 4425 Walnut Ave
- 2739 Denmead St
- 4944 Coke Ave
- 4848 Oliva Ave
- 3829 Cherry Ave
- 4251 Gundry Ave
- 4520 Pepperwood Ave
- 4532 Pepperwood Ave
- 2733 Flangel St
- 2743 Flangel St
- 2803 Flangel St
- 2727 Flangel St
- 2806 Bomberry St
- 2802 Bomberry St
- 2812 Bomberry St
- 2728 Bomberry St
- 2809 Flangel St
- 2723 Flangel St
- 2818 Bomberry St
- 2738 Flangel St
- 2732 Flangel St
- 2742 Flangel St
- 2722 Bomberry St
- 2728 Flangel St
- 2802 Flangel St
- 2822 Bomberry St
- 2717 Flangel St
- 2813 Flangel St