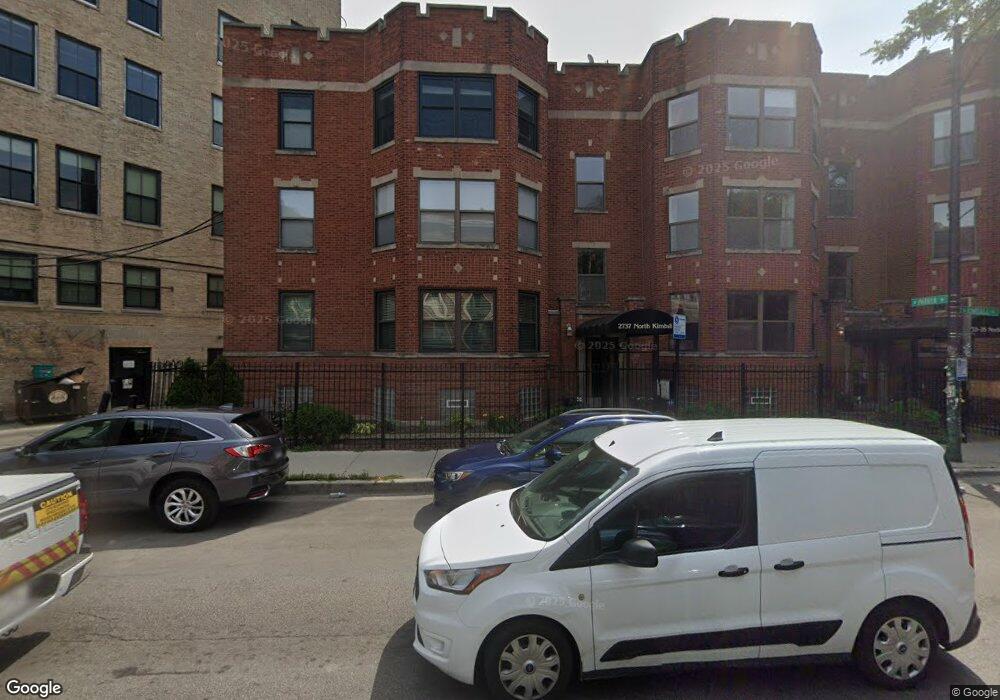
2737 N Kimball Ave Unit 3 Chicago, IL 60647
Logan Square NeighborhoodEstimated Value: $258,000 - $355,000
--
Bed
--
Bath
16,200
Sq Ft
$18/Sq Ft
Est. Value
About This Home
This home is located at 2737 N Kimball Ave Unit 3, Chicago, IL 60647 and is currently estimated at $291,319, approximately $17 per square foot. 2737 N Kimball Ave Unit 3 is a home located in Cook County with nearby schools including Avondale-Logandale Elementary School, Clemente Community Academy High School, and Aspira Business & Finance High School.
Ownership History
Date
Name
Owned For
Owner Type
Purchase Details
Closed on
Feb 12, 2024
Sold by
Milich Megan
Bought by
Alarcon Anthony
Current Estimated Value
Home Financials for this Owner
Home Financials are based on the most recent Mortgage that was taken out on this home.
Original Mortgage
$237,650
Outstanding Balance
$233,843
Interest Rate
7.13%
Mortgage Type
New Conventional
Estimated Equity
$57,476
Purchase Details
Closed on
May 22, 2008
Sold by
2733-37 Kimball Llc
Bought by
Milich Megan
Home Financials for this Owner
Home Financials are based on the most recent Mortgage that was taken out on this home.
Original Mortgage
$170,910
Interest Rate
5.93%
Mortgage Type
Purchase Money Mortgage
Create a Home Valuation Report for This Property
The Home Valuation Report is an in-depth analysis detailing your home's value as well as a comparison with similar homes in the area
Home Values in the Area
Average Home Value in this Area
Purchase History
| Date | Buyer | Sale Price | Title Company |
|---|---|---|---|
| Alarcon Anthony | $245,000 | First American Title | |
| Milich Megan | $190,000 | Cti |
Source: Public Records
Mortgage History
| Date | Status | Borrower | Loan Amount |
|---|---|---|---|
| Open | Alarcon Anthony | $237,650 | |
| Previous Owner | Milich Megan | $170,910 |
Source: Public Records
Tax History Compared to Growth
Tax History
| Year | Tax Paid | Tax Assessment Tax Assessment Total Assessment is a certain percentage of the fair market value that is determined by local assessors to be the total taxable value of land and additions on the property. | Land | Improvement |
|---|---|---|---|---|
| 2024 | $4,591 | $28,619 | $2,849 | $25,770 |
| 2023 | $4,454 | $25,001 | $2,289 | $22,712 |
| 2022 | $4,454 | $25,001 | $2,289 | $22,712 |
| 2021 | $4,372 | $24,999 | $2,288 | $22,711 |
| 2020 | $4,056 | $21,243 | $1,048 | $20,195 |
| 2019 | $4,102 | $23,773 | $1,048 | $22,725 |
| 2018 | $4,264 | $25,024 | $1,048 | $23,976 |
| 2017 | $4,084 | $22,346 | $917 | $21,429 |
| 2016 | $3,975 | $22,346 | $917 | $21,429 |
| 2015 | $3,830 | $23,523 | $917 | $22,606 |
| 2014 | $1,940 | $13,024 | $786 | $12,238 |
| 2013 | $1,890 | $13,024 | $786 | $12,238 |
Source: Public Records
Map
Nearby Homes
- 2628 N Spaulding Ave Unit 1
- 2815 N Kimball Ave Unit 1
- 2714 N Kedzie Ave Unit 3
- 3541 W Wrightwood Ave
- 2952 N Wisner Ave
- 2630 N Central Park Ave
- 2934 N Sawyer Ave
- 2736 N Monticello Ave
- 2955 N Spaulding Ave
- 3027 N Elbridge Ave
- 3043 W Diversey Ave
- 2925 N Troy St
- 2529 N Lawndale Ave
- 2506 N Monticello Ave
- 1617 N Sawyer Ave
- 2342 N Kimball Ave
- 2435 N Monticello Ave
- 3037 N Central Park Ave
- 2837 N Ridgeway Ave
- 3054 N Kedzie Ave Unit 1F
- 2733 N Kimball Ave Unit P2
- 2733 N Kimball Ave Unit 27339
- 2733 N Kimball Ave Unit 27337
- 2733 N Kimball Ave Unit P1
- 2733 N Kimball Ave Unit 27338
- 2733 N Kimball Ave Unit 8
- 2733 N Kimball Ave Unit 7
- 2733 N Kimball Ave Unit 9
- 2737 N Kimball Ave Unit 27372
- 2737 N Kimball Ave Unit 27371
- 2737 N Kimball Ave Unit 3
- 2737 N Kimball Ave Unit 2
- 2737 N Kimball Ave Unit 1
- 2735 N Kimball Ave Unit 27356
- 2735 N Kimball Ave Unit 27355
- 2735 N Kimball Ave Unit 6
- 2735 N Kimball Ave Unit 5
- 2729 N Kimball Ave
- 2729 N Kimball Ave Unit 2
- 2725 N Kimball Ave