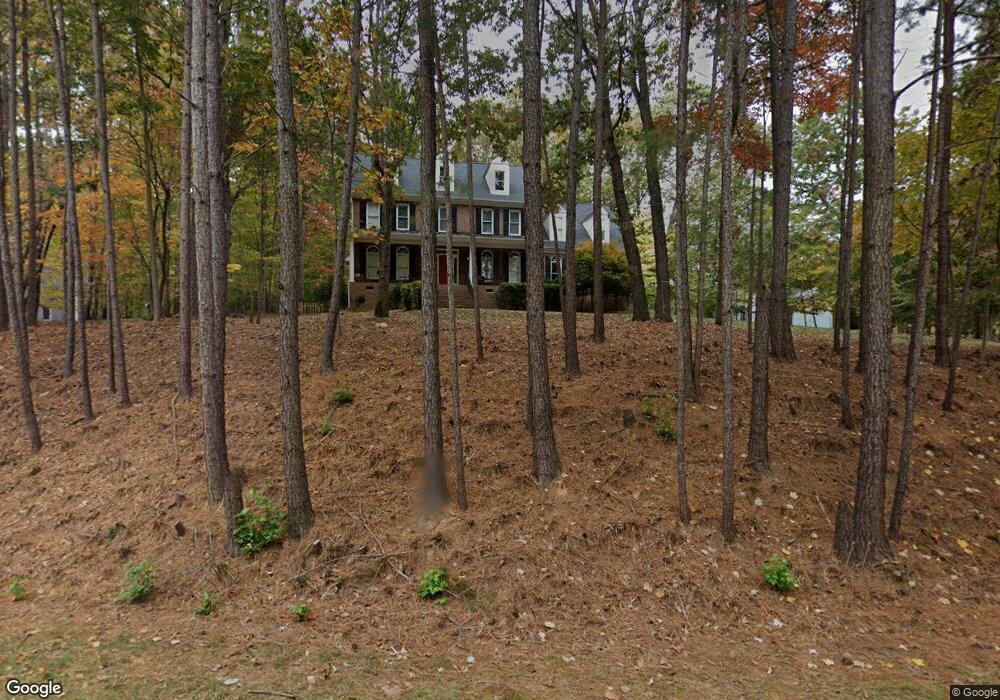
2737 Sunnystone Way Raleigh, NC 27613
Estimated Value: $779,000 - $922,000
4
Beds
3
Baths
2,952
Sq Ft
$292/Sq Ft
Est. Value
About This Home
This home is located at 2737 Sunnystone Way, Raleigh, NC 27613 and is currently estimated at $862,049, approximately $292 per square foot. 2737 Sunnystone Way is a home located in Wake County with nearby schools including Pine Hollow Middle School, Leesville Road High School, and The Franciscan School.
Ownership History
Date
Name
Owned For
Owner Type
Purchase Details
Closed on
Jun 15, 2017
Sold by
Watkins John Jmn and Watkins Tara
Bought by
Palmieri Vincnet and Palmieri Teresa
Current Estimated Value
Home Financials for this Owner
Home Financials are based on the most recent Mortgage that was taken out on this home.
Original Mortgage
$412,110
Outstanding Balance
$342,036
Interest Rate
3.94%
Mortgage Type
New Conventional
Estimated Equity
$520,013
Purchase Details
Closed on
Aug 13, 2007
Sold by
Disandro Vincent M and Disandro Sharon M
Bought by
Watkins John J and Watkins Tara
Home Financials for this Owner
Home Financials are based on the most recent Mortgage that was taken out on this home.
Original Mortgage
$265,000
Interest Rate
6.25%
Mortgage Type
Purchase Money Mortgage
Purchase Details
Closed on
Mar 30, 2001
Sold by
Bill Clark Homes Of Raleigh Llc
Bought by
Disandro Vincent M and Disandro Sharon M
Create a Home Valuation Report for This Property
The Home Valuation Report is an in-depth analysis detailing your home's value as well as a comparison with similar homes in the area
Home Values in the Area
Average Home Value in this Area
Purchase History
| Date | Buyer | Sale Price | Title Company |
|---|---|---|---|
| Palmieri Vincnet | $458,000 | None Available | |
| Watkins John J | $411,000 | None Available | |
| Disandro Vincent M | $315,500 | -- |
Source: Public Records
Mortgage History
| Date | Status | Borrower | Loan Amount |
|---|---|---|---|
| Open | Palmieri Vincnet | $412,110 | |
| Previous Owner | Watkins John J | $265,000 |
Source: Public Records
Tax History Compared to Growth
Tax History
| Year | Tax Paid | Tax Assessment Tax Assessment Total Assessment is a certain percentage of the fair market value that is determined by local assessors to be the total taxable value of land and additions on the property. | Land | Improvement |
|---|---|---|---|---|
| 2025 | $5,415 | $843,497 | $170,000 | $673,497 |
| 2024 | $4,406 | $706,228 | $170,000 | $536,228 |
| 2023 | $3,744 | $477,615 | $100,000 | $377,615 |
| 2022 | $3,420 | $470,851 | $100,000 | $370,851 |
| 2021 | $3,329 | $470,851 | $100,000 | $370,851 |
| 2020 | $3,274 | $470,851 | $100,000 | $370,851 |
| 2019 | $3,415 | $415,656 | $95,000 | $320,656 |
| 2018 | $3,139 | $415,656 | $95,000 | $320,656 |
| 2017 | $2,726 | $380,599 | $95,000 | $285,599 |
| 2016 | $2,671 | $380,599 | $95,000 | $285,599 |
| 2015 | $2,744 | $392,234 | $104,000 | $288,234 |
| 2014 | $2,601 | $392,234 | $104,000 | $288,234 |
Source: Public Records
Map
Nearby Homes
- 2729 Sunnystone Way
- 12304 Whartons Way
- 11953 Eagle Cliff Ct
- 11913 Eagle Bluff Cir
- 5308 Roan Mountain Place
- 2409 Loring Ct
- 5528 Hawthorne Park
- 5240 Indigo Moon Way
- 12316 Amoretto Way
- 11804 Mountbatten Way
- 11017 Peacock Moss St
- 5316 Easthorpe Dr
- 11113 N Radner Way
- 1204 Meadow Moss Ct
- 5501 Stewartby Dr
- 2612 Scarlet Sage Ct
- 12316 Inglehurst Dr
- 5020 Red Cedar Rd
- 12200 Inglehurst Dr
- 11209 Sedgefield Dr
- 2809 Sunnystone Way
- 2733 Sunnystone Way
- 2817 Sunnystone Way
- 2840 Sunnystone Way
- 2732 Sunnystone Way
- 2901 Sunnystone Way
- 2808 Sunnystone Way
- 2804 Sunnystone Way
- 5201 Six Pence Ct
- 2812 Sunnystone Way
- 5204 Six Pence Ct
- 2905 Sunnystone Way
- 2728 Sunnystone Way
- 5208 Six Pence Ct
- 2816 Sunnystone Way
- 2909 Sunnystone Way
- 2724 Sunnystone Way
- 5205 Six Pence Ct
- 2721 Sunnystone Way
- 5120 Big Creek Rd