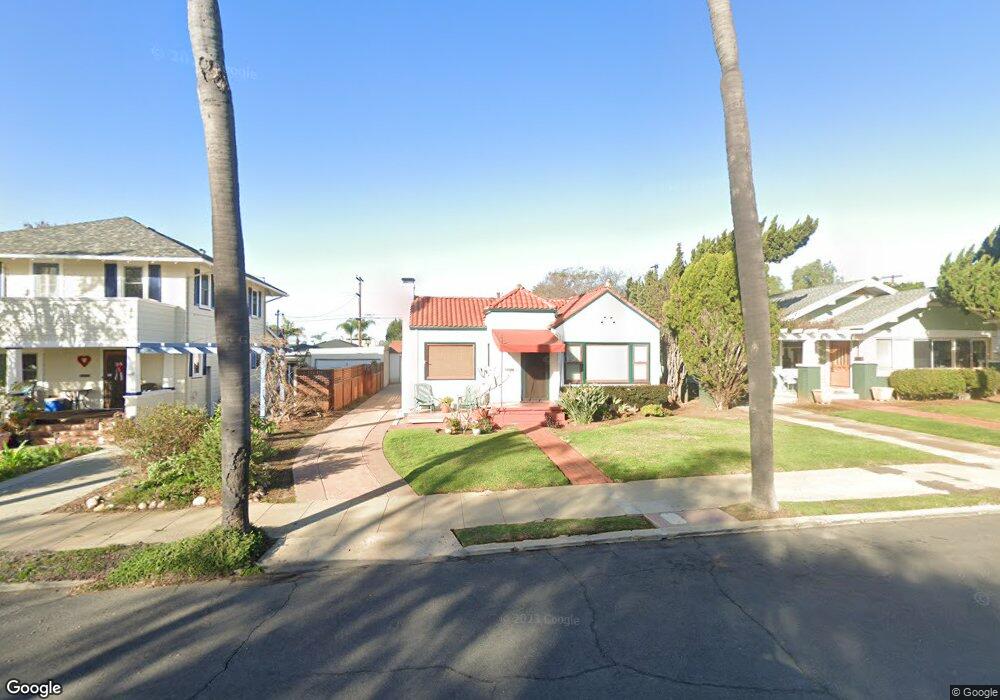
2738 29th St San Diego, CA 92104
North Park NeighborhoodEstimated Value: $1,156,481 - $1,376,000
2
Beds
1
Bath
1,213
Sq Ft
$1,082/Sq Ft
Est. Value
About This Home
This home is located at 2738 29th St, San Diego, CA 92104 and is currently estimated at $1,312,120, approximately $1,081 per square foot. 2738 29th St is a home located in San Diego County with nearby schools including McKinley Elementary School, Roosevelt International Middle School, and Mcgill School Of Success.
Ownership History
Date
Name
Owned For
Owner Type
Purchase Details
Closed on
Sep 17, 2025
Sold by
Mary A Lakatos Trust and Lakatos Mary A
Bought by
Kuttler Lakatos Trust and Kuttler
Current Estimated Value
Purchase Details
Closed on
Dec 10, 1999
Sold by
Lakatos Mary A
Bought by
Lakatos Mary A
Purchase Details
Closed on
Sep 27, 1994
Sold by
Eggers Frank R
Bought by
Lakatos Mary A
Home Financials for this Owner
Home Financials are based on the most recent Mortgage that was taken out on this home.
Original Mortgage
$165,150
Interest Rate
5.5%
Purchase Details
Closed on
Jan 12, 1983
Create a Home Valuation Report for This Property
The Home Valuation Report is an in-depth analysis detailing your home's value as well as a comparison with similar homes in the area
Home Values in the Area
Average Home Value in this Area
Purchase History
| Date | Buyer | Sale Price | Title Company |
|---|---|---|---|
| Kuttler Lakatos Trust | -- | None Listed On Document | |
| Lakatos Mary A | -- | -- | |
| Lakatos Mary A | $183,500 | Orange Coast Title Company | |
| -- | $107,300 | -- |
Source: Public Records
Mortgage History
| Date | Status | Borrower | Loan Amount |
|---|---|---|---|
| Previous Owner | Lakatos Mary A | $165,150 |
Source: Public Records
Tax History Compared to Growth
Tax History
| Year | Tax Paid | Tax Assessment Tax Assessment Total Assessment is a certain percentage of the fair market value that is determined by local assessors to be the total taxable value of land and additions on the property. | Land | Improvement |
|---|---|---|---|---|
| 2025 | $3,692 | $308,197 | $207,432 | $100,765 |
| 2024 | $3,692 | $302,155 | $203,365 | $98,790 |
| 2023 | $3,607 | $296,231 | $199,378 | $96,853 |
| 2022 | $3,509 | $290,423 | $195,469 | $94,954 |
| 2021 | $3,482 | $284,730 | $191,637 | $93,093 |
| 2020 | $3,439 | $281,811 | $189,672 | $92,139 |
| 2019 | $3,376 | $276,286 | $185,953 | $90,333 |
| 2018 | $3,157 | $270,869 | $182,307 | $88,562 |
| 2017 | $3,080 | $265,559 | $178,733 | $86,826 |
| 2016 | $3,028 | $260,353 | $175,229 | $85,124 |
| 2015 | $2,983 | $256,443 | $172,597 | $83,846 |
| 2014 | $2,935 | $251,421 | $169,217 | $82,204 |
Source: Public Records
Map
Nearby Homes