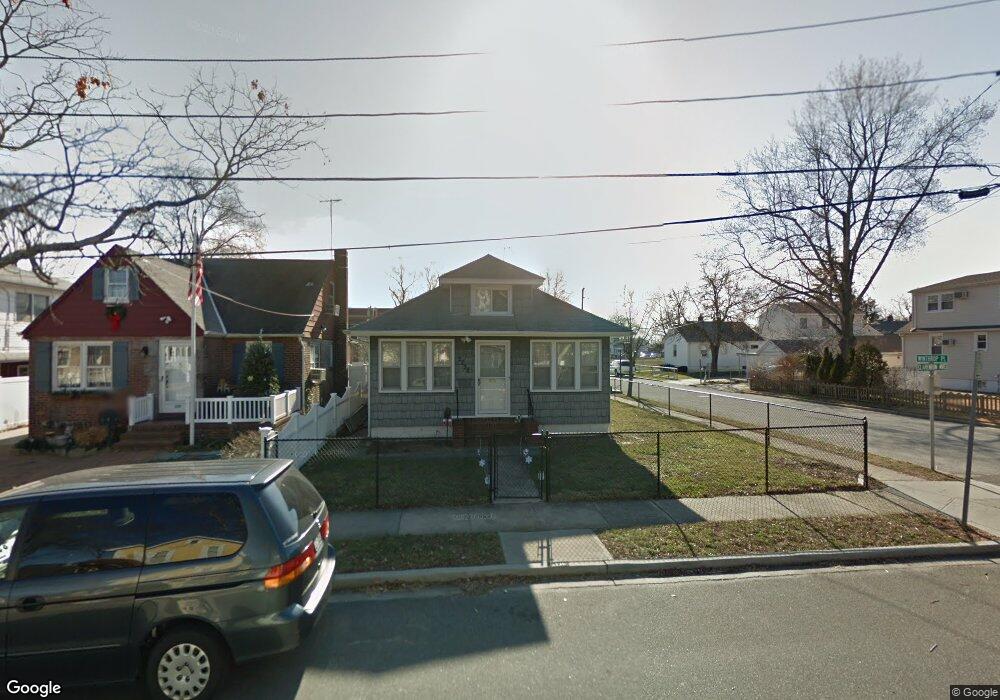
2738 Clarendon Ave Bellmore, NY 11710
Estimated Value: $626,000 - $656,925
2
Beds
2
Baths
1,100
Sq Ft
$583/Sq Ft
Est. Value
About This Home
This home is located at 2738 Clarendon Ave, Bellmore, NY 11710 and is currently estimated at $641,463, approximately $583 per square foot. 2738 Clarendon Ave is a home located in Nassau County with nearby schools including Winthrop Avenue School, Shore Road School, and Grand Avenue Middle School.
Ownership History
Date
Name
Owned For
Owner Type
Purchase Details
Closed on
Oct 10, 2019
Sold by
Cahill Conan
Bought by
Cahill Conan
Current Estimated Value
Purchase Details
Closed on
Jul 12, 2018
Sold by
Mercado Brendalis
Bought by
Cahill Conan
Home Financials for this Owner
Home Financials are based on the most recent Mortgage that was taken out on this home.
Original Mortgage
$407,483
Outstanding Balance
$353,145
Interest Rate
4.5%
Mortgage Type
FHA
Estimated Equity
$288,318
Purchase Details
Closed on
Aug 9, 2011
Sold by
Curraro Joseph
Bought by
Mercado Brendalis
Home Financials for this Owner
Home Financials are based on the most recent Mortgage that was taken out on this home.
Original Mortgage
$277,775
Interest Rate
4.5%
Mortgage Type
FHA
Purchase Details
Closed on
May 20, 2009
Sold by
Currao Angelina and Currao Joseph
Bought by
Joseph
Create a Home Valuation Report for This Property
The Home Valuation Report is an in-depth analysis detailing your home's value as well as a comparison with similar homes in the area
Home Values in the Area
Average Home Value in this Area
Purchase History
| Date | Buyer | Sale Price | Title Company |
|---|---|---|---|
| Cahill Conan | -- | Chicago Title | |
| Cahill Conan | $415,000 | Amtrust Title | |
| Mercado Brendalis | $285,000 | -- | |
| Joseph | -- | None Available |
Source: Public Records
Mortgage History
| Date | Status | Borrower | Loan Amount |
|---|---|---|---|
| Open | Cahill Conan | $407,483 | |
| Previous Owner | Mercado Brendalis | $277,775 |
Source: Public Records
Tax History Compared to Growth
Tax History
| Year | Tax Paid | Tax Assessment Tax Assessment Total Assessment is a certain percentage of the fair market value that is determined by local assessors to be the total taxable value of land and additions on the property. | Land | Improvement |
|---|---|---|---|---|
| 2025 | $11,632 | $383 | $215 | $168 |
| 2024 | $2,892 | $383 | $215 | $168 |
| 2023 | $11,067 | $383 | $215 | $168 |
| 2022 | $11,067 | $383 | $215 | $168 |
| 2021 | $15,423 | $362 | $146 | $216 |
| 2020 | $10,782 | $569 | $538 | $31 |
| 2019 | $2,702 | $569 | $538 | $31 |
| 2018 | $2,598 | $569 | $0 | $0 |
| 2017 | $5,227 | $604 | $446 | $158 |
| 2016 | $7,873 | $728 | $538 | $190 |
| 2015 | $2,969 | $728 | $538 | $190 |
| 2014 | $2,969 | $728 | $538 | $190 |
| 2013 | $2,994 | $782 | $538 | $244 |
Source: Public Records
Map
Nearby Homes
- 2726 Clarendon Ave
- No# Clarendon Ave
- 402 Marle Place
- 111 1st Place
- 8 Trezza Ct
- 2325 Centre Ave
- 2728 Wilson Ave
- 2398 Centre Ave
- 2806 Wilson Ave
- 21 Beverly Rd
- 2460 Centre Ave
- 2280 Hynes Place
- 508 Bedford Ave Unit 3
- 118 Linden St
- 201 Argyle Place
- 906 Ardmore Place
- 732 Sunrise Ave
- 601 Hughes St
- 2055 Hillside Ave
- 2436 Hempstead Ln
- 2742 Clarendon Ave
- 2746 Clarendon Ave
- 2737 Marle Place
- 2732 Clarendon Ave
- 2743 Marle Place
- 204 Marle Place
- 2750 Clarendon Ave
- 2743 Clarendon Ave
- 110 Marle Place
- 206 Marle Place
- 106 Marle Place
- 2754 Clarendon Ave
- 2737 Clarendon Ave
- 208 Marle Place
- 2745 Clarendon Ave
- 2731 Clarendon Ave
- 102 Marle Place
- 2749 Clarendon Ave
- 2722 Clarendon Ave
- 2758 Clarendon Ave