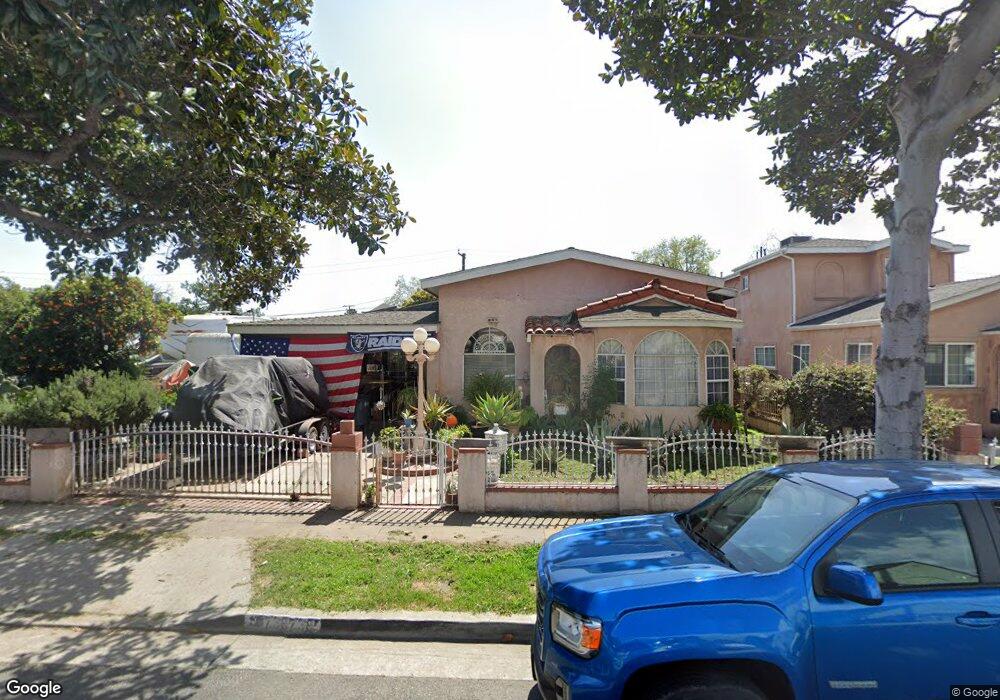
2738 E Van Buren St Long Beach, CA 90810
Estimated Value: $623,000 - $680,000
2
Beds
1
Bath
953
Sq Ft
$690/Sq Ft
Est. Value
About This Home
This home is located at 2738 E Van Buren St, Long Beach, CA 90810 and is currently estimated at $658,016, approximately $690 per square foot. 2738 E Van Buren St is a home located in Los Angeles County with nearby schools including Dominguez Elementary School, Rancho Dominguez Preparatory School, and Pacific Baptist School.
Ownership History
Date
Name
Owned For
Owner Type
Purchase Details
Closed on
Aug 30, 2019
Sold by
Guerrero Juan and Guerrero Linda Faye
Bought by
Guerrero Juan and Guerrero Linda Faye
Current Estimated Value
Home Financials for this Owner
Home Financials are based on the most recent Mortgage that was taken out on this home.
Original Mortgage
$175,000
Outstanding Balance
$153,600
Interest Rate
3.7%
Mortgage Type
Credit Line Revolving
Estimated Equity
$504,416
Purchase Details
Closed on
Mar 16, 2019
Sold by
Linares Raylynn S and Velazquez Raylynn S
Bought by
Guerrero Juan and Guerrero Linda Faye
Purchase Details
Closed on
Mar 15, 2019
Sold by
Guerrero Anthony and Guerrero Daniel J
Bought by
Guerrero Juan and Guerrero Linda Faye
Purchase Details
Closed on
Jun 20, 2012
Sold by
Guerrero Juan and Guerrero Linda F
Bought by
Velazquez Raylynn S and Guerrero Daniel J
Purchase Details
Closed on
Jan 4, 1994
Sold by
Guerrero Juan
Bought by
Rivera Linda F
Create a Home Valuation Report for This Property
The Home Valuation Report is an in-depth analysis detailing your home's value as well as a comparison with similar homes in the area
Home Values in the Area
Average Home Value in this Area
Purchase History
| Date | Buyer | Sale Price | Title Company |
|---|---|---|---|
| Guerrero Juan | -- | First American Title Ins Co | |
| Guerrero Juan | -- | None Available | |
| Guerrero Juan | -- | None Available | |
| Velazquez Raylynn S | -- | None Available | |
| Rivera Linda F | -- | -- |
Source: Public Records
Mortgage History
| Date | Status | Borrower | Loan Amount |
|---|---|---|---|
| Open | Guerrero Juan | $175,000 |
Source: Public Records
Tax History Compared to Growth
Tax History
| Year | Tax Paid | Tax Assessment Tax Assessment Total Assessment is a certain percentage of the fair market value that is determined by local assessors to be the total taxable value of land and additions on the property. | Land | Improvement |
|---|---|---|---|---|
| 2025 | $3,649 | $241,551 | $180,004 | $61,547 |
| 2024 | $3,649 | $236,816 | $176,475 | $60,341 |
| 2023 | $3,577 | $232,173 | $173,015 | $59,158 |
| 2022 | $3,495 | $227,622 | $169,623 | $57,999 |
| 2021 | $3,371 | $223,160 | $166,298 | $56,862 |
| 2020 | $3,367 | $220,872 | $164,593 | $56,279 |
| 2019 | $3,251 | $216,542 | $161,366 | $55,176 |
| 2018 | $3,069 | $212,297 | $158,202 | $54,095 |
| 2016 | $3,009 | $204,055 | $152,059 | $51,996 |
| 2015 | $2,943 | $200,990 | $149,775 | $51,215 |
| 2014 | $2,937 | $197,054 | $146,842 | $50,212 |
Source: Public Records
Map
Nearby Homes
- 2744 E Madison St
- 2657 E Monroe St
- 2743 E 219th Place
- 2805 E 221st Place
- 2616 E 220th Place
- 4184 Del Mar Ave
- 4733 Holly Ave
- 4092 Del Mar Ave
- 233 W 47th St
- 1801 W Cameron St
- 4841 Holly Ave
- 4112 Del Mar Ave
- 4116 Del Mar Ave
- 4889 Holly Ave
- 2216 W Wardlow Rd
- 4925 Holly Ave
- 4907 Brook Ave
- 3634 Caspian Ave
- 1219 W Maddox St
- 3630 River Ave
- 2736 E Van Buren St
- 2748 E Van Buren St
- 2734 E Van Buren St
- 2745 E Jackson St
- 2739 E Jackson St
- 2735 E Jackson St
- 2749 E Jackson St
- 2730 E Van Buren St
- 2754 E Van Buren St
- 2733 E Jackson St
- 2743 E Van Buren St
- 2745 E Van Buren St
- 2737 E Van Buren St
- 2747 E Van Buren St
- 2753 E Jackson St
- 2735 E Van Buren St
- 2726 E Van Buren St
- 2758 E Van Buren St
- 2731 E Jackson St
- 2751 E Van Buren St