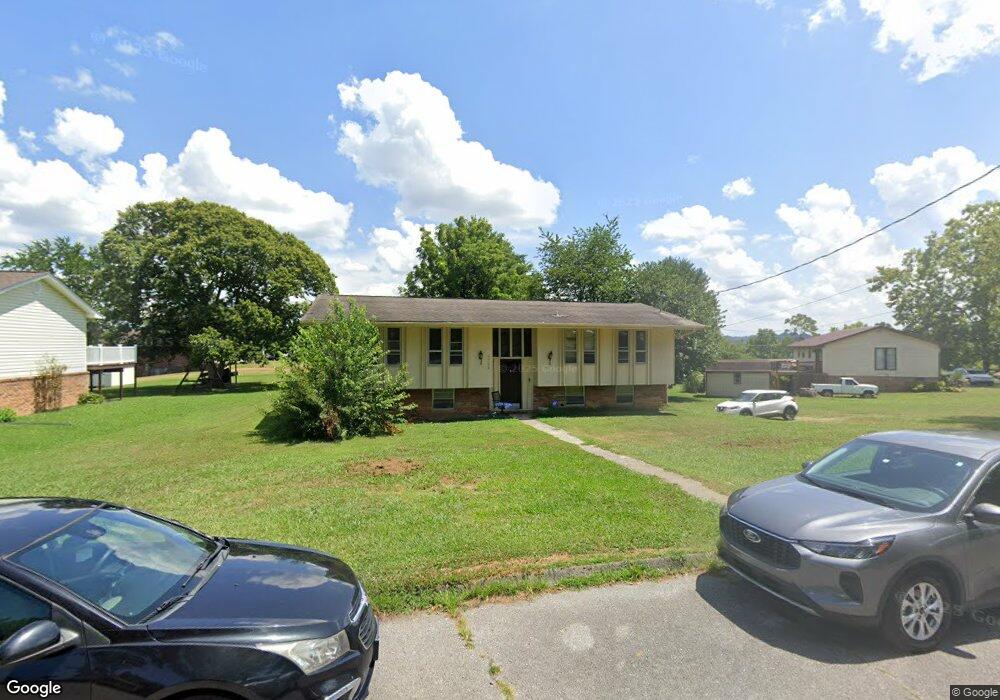
2738 Stacy Ave Morristown, TN 37814
Estimated Value: $160,757 - $298,000
--
Bed
2
Baths
1,184
Sq Ft
$179/Sq Ft
Est. Value
About This Home
This home is located at 2738 Stacy Ave, Morristown, TN 37814 and is currently estimated at $212,439, approximately $179 per square foot. 2738 Stacy Ave is a home located in Hamblen County with nearby schools including Fairview-Marguerite Elementary School, Meadowview Middle School, and Morristown East High School.
Ownership History
Date
Name
Owned For
Owner Type
Purchase Details
Closed on
Dec 19, 2018
Sold by
Lemka Jason Ray
Bought by
Berg Robert and Berg Melissa
Current Estimated Value
Home Financials for this Owner
Home Financials are based on the most recent Mortgage that was taken out on this home.
Original Mortgage
$78,347
Outstanding Balance
$69,025
Interest Rate
4.8%
Mortgage Type
FHA
Estimated Equity
$143,414
Purchase Details
Closed on
Jan 31, 2018
Sold by
Lemka Investments Llc
Bought by
Lemka Jason Ray and Lemka Jason R
Purchase Details
Closed on
Jun 20, 2013
Sold by
Lemka Kenneth Ray
Bought by
Lemka Investments Llc
Purchase Details
Closed on
May 28, 2013
Sold by
Brewster Ralph
Bought by
Lemka Jason R and Lemka Kenneth R
Purchase Details
Closed on
Oct 1, 2001
Sold by
Fred Sizemore
Bought by
Brewster Ralph
Purchase Details
Closed on
Jul 19, 1975
Bought by
Sizemore Fred B and Sizemore Betty
Create a Home Valuation Report for This Property
The Home Valuation Report is an in-depth analysis detailing your home's value as well as a comparison with similar homes in the area
Home Values in the Area
Average Home Value in this Area
Purchase History
| Date | Buyer | Sale Price | Title Company |
|---|---|---|---|
| Berg Robert | $85,000 | Express Title & Closing Llc | |
| Lemka Jason Ray | -- | None Available | |
| Lemka Investments Llc | -- | -- | |
| Lemka Jason R | $45,100 | -- | |
| Brewster Ralph | $66,000 | -- | |
| Sizemore Fred B | $28,300 | -- |
Source: Public Records
Mortgage History
| Date | Status | Borrower | Loan Amount |
|---|---|---|---|
| Open | Berg Robert | $78,347 |
Source: Public Records
Tax History Compared to Growth
Tax History
| Year | Tax Paid | Tax Assessment Tax Assessment Total Assessment is a certain percentage of the fair market value that is determined by local assessors to be the total taxable value of land and additions on the property. | Land | Improvement |
|---|---|---|---|---|
| 2024 | $461 | $23,400 | $3,725 | $19,675 |
| 2023 | $461 | $23,400 | $0 | $0 |
| 2022 | $461 | $23,400 | $3,725 | $19,675 |
| 2021 | $461 | $23,400 | $3,725 | $19,675 |
| 2020 | $461 | $23,400 | $3,725 | $19,675 |
| 2019 | $421 | $19,775 | $3,625 | $16,150 |
| 2018 | $421 | $19,775 | $3,625 | $16,150 |
| 2017 | $421 | $19,775 | $3,625 | $16,150 |
| 2016 | $394 | $19,775 | $3,625 | $16,150 |
| 2015 | $366 | $19,775 | $3,625 | $16,150 |
| 2014 | -- | $19,775 | $3,625 | $16,150 |
| 2013 | -- | $23,175 | $0 | $0 |
Source: Public Records
Map
Nearby Homes
- 2748 Stacy Ave
- 1215 Deneen Ln
- 1225 Deneen Ln
- 2758 Stacy Ave
- 2743 Stacy Ave
- 2733 Stacy Ave
- 2723 Stacy Ave
- 1220 Deneen Ln
- 2713 Stacy Ave
- 1226 Deneen Ln
- 1216 Deneen Ln
- 2760 Stacy Ave
- 2695 Stacy Ave
- 1239 Deneen Ln
- 1232 Deneen Ln
- 2685 Stacy Ave
- 2753 Stacy Ave
- 2778 Stacy Ave
- 1238 Deneen Ln
- 2727 Northview Dr