

2738 W Tharpe St Tallahassee, FL 32303
Hartsfield Neighborhood
3
Beds
3
Baths
1,209
Sq Ft
$169/mo
HOA Fee
Highlights
- In Ground Pool
- Traditional Architecture
- Main Floor Primary Bedroom
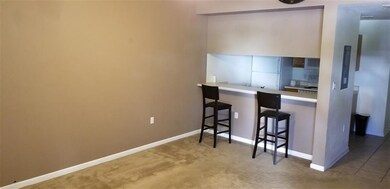
- Open Floorplan
- Cathedral Ceiling
- Covered patio or porch
About This Home
As of April 2024Sold 2K over appraisal. Currently rented at $1,300 month through 4/30/23. There is a 60 day sale clause. Very well maintained unit. Community Pool, Basketball, Bus Line, and a good NW Location.
Last Agent to Sell the Property
Investors Realty Of Tallahasse License #525368 Listed on: 07/14/2022
Property Details
Home Type
- Condominium
Est. Annual Taxes
- $2,083
Year Built
- Built in 2004
Lot Details
- Property fronts a private road
HOA Fees
- $169 Monthly HOA Fees
Parking
- Driveway
Home Design
- Traditional Architecture
- Vinyl Siding
- Brick Front
Interior Spaces
- 1,209 Sq Ft Home
- 2-Story Property
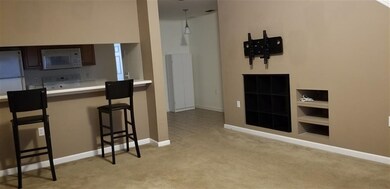
- Open Floorplan
- Cathedral Ceiling
- Ceiling Fan
- Window Treatments
- Utility Room
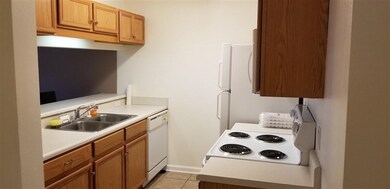
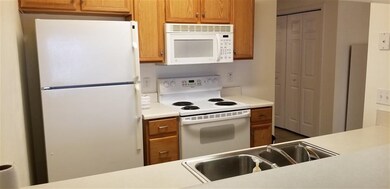
Kitchen
- Breakfast Bar
- Oven or Range
- Microwave
- Dishwasher
- Disposal
Flooring
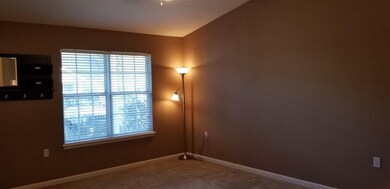
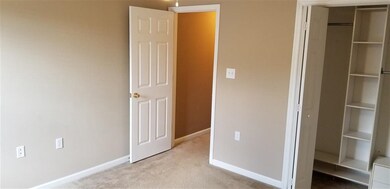
- Carpet
- Tile
Bedrooms and Bathrooms
- 3 Bedrooms
- Primary Bedroom on Main
- Primary Bedroom Upstairs
- 3 Full Bathrooms
Laundry
- Dryer
- Washer
Outdoor Features
- In Ground Pool
- Covered patio or porch
Schools
- Riley Elementary School
- Griffin Middle School
- Godby High School
Utilities
- Central Heating and Cooling System
- Heat Pump System
- Water Heater
Listing and Financial Details
- Assessor Parcel Number 12073-21-21-32-023-003-0
Community Details
Overview
- Association fees include common area, community pool, maintenance - exterior, maintenance - road, street lights, trash/garbage, playground/park, club house amenities, maintenance - lawn
- Savannah Crossing Condominium Subdivision
Recreation
- Community Pool
Ownership History
Date
Name
Owned For
Owner Type
Purchase Details
Closed on
Jul 13, 2021
Sold by
Lorin Investments Llc
Bought by
Buono Karen B and Buono David
Current Estimated Value
Home Financials for this Owner
Home Financials are based on the most recent Mortgage that was taken out on this home.
Original Mortgage
$84,000
Outstanding Balance
$77,070
Interest Rate
2.93%
Mortgage Type
New Conventional
Estimated Equity
$74,358
Purchase Details
Closed on
Apr 17, 2018
Sold by
Marr Trent and Marr Jessica
Bought by
Lorin Investments Llc
Purchase Details
Closed on
Apr 16, 2018
Sold by
Marr Trent and Marr Mary
Bought by
Lorin Onvestments Llc
Purchase Details
Closed on
Dec 30, 2011
Sold by
Marr Trent and Marr Mary
Bought by
Marr Trent and Marr Mary
Purchase Details
Closed on
Aug 20, 2004
Sold by
B & T Developers Llc
Bought by
Davis Clark and Davis Eleese
Home Financials for this Owner
Home Financials are based on the most recent Mortgage that was taken out on this home.
Original Mortgage
$110,700
Interest Rate
5.97%
Mortgage Type
Credit Line Revolving
Similar Homes in Tallahassee, FL
Create a Home Valuation Report for This Property
The Home Valuation Report is an in-depth analysis detailing your home's value as well as a comparison with similar homes in the area
Home Values in the Area
Average Home Value in this Area
Purchase History
| Date | Type | Sale Price | Title Company |
|---|---|---|---|
| Warranty Deed | $105,000 | Hayward Title Group | |
| Warranty Deed | $84,000 | None Listed On Document | |
| Warranty Deed | $84,000 | Attorney | |
| Interfamily Deed Transfer | -- | None Available | |
| Warranty Deed | $123,000 | -- |
Source: Public Records
Mortgage History
| Date | Status | Loan Amount | Loan Type |
|---|---|---|---|
| Open | $84,000 | New Conventional | |
| Previous Owner | $117,800 | Fannie Mae Freddie Mac | |
| Previous Owner | $110,700 | Credit Line Revolving |
Source: Public Records
Property History
| Date | Event | Price | Change | Sq Ft Price |
|---|---|---|---|---|
| 08/01/2024 08/01/24 | Rented | $600 | 0.0% | -- |
| 07/06/2024 07/06/24 | Price Changed | $600 | -64.7% | $0 / Sq Ft |
| 06/05/2024 06/05/24 | Price Changed | $1,700 | -5.6% | $1 / Sq Ft |
| 05/28/2024 05/28/24 | For Rent | $1,800 | 0.0% | -- |
| 04/26/2024 04/26/24 | Sold | $148,000 | -1.3% | $122 / Sq Ft |
| 03/12/2024 03/12/24 | For Sale | $149,900 | 0.0% | $124 / Sq Ft |
| 11/19/2023 11/19/23 | Rented | $1,325,000 | +99900.0% | -- |
| 10/25/2023 10/25/23 | For Rent | $1,325 | 0.0% | -- |
| 09/23/2022 09/23/22 | Sold | $147,000 | +31.3% | $122 / Sq Ft |
| 08/19/2022 08/19/22 | Sold | $112,000 | -10.4% | $93 / Sq Ft |
| 08/09/2022 08/09/22 | For Sale | $125,000 | -16.7% | $104 / Sq Ft |
| 07/14/2022 07/14/22 | For Sale | $150,000 | 0.0% | $124 / Sq Ft |
| 03/17/2022 03/17/22 | Rented | $1,100 | 0.0% | -- |
| 03/02/2022 03/02/22 | Price Changed | $1,100 | 0.0% | $1 / Sq Ft |
| 03/02/2022 03/02/22 | For Rent | $1,100 | 0.0% | -- |
| 02/18/2022 02/18/22 | Sold | $128,500 | +2.8% | $106 / Sq Ft |
| 02/01/2022 02/01/22 | For Sale | $125,000 | 0.0% | $103 / Sq Ft |
| 10/13/2020 10/13/20 | Rented | $1,000 | 0.0% | -- |
| 10/02/2020 10/02/20 | Price Changed | $1,000 | -9.1% | $1 / Sq Ft |
| 08/28/2020 08/28/20 | For Rent | $1,100 | 0.0% | -- |
| 06/30/2020 06/30/20 | Rented | $1,100 | -8.3% | -- |
| 06/01/2020 06/01/20 | For Rent | $1,200 | +20.0% | -- |
| 07/26/2019 07/26/19 | Rented | $1,000 | 0.0% | -- |
| 06/16/2019 06/16/19 | Price Changed | $1,000 | -16.7% | $1 / Sq Ft |
| 06/09/2019 06/09/19 | Price Changed | $1,200 | -99.9% | $1 / Sq Ft |
| 06/09/2019 06/09/19 | For Rent | $1,200,000 | 0.0% | -- |
| 12/28/2018 12/28/18 | Sold | $85,000 | -5.6% | $70 / Sq Ft |
| 09/08/2018 09/08/18 | For Sale | $90,000 | +5.9% | $74 / Sq Ft |
| 06/29/2018 06/29/18 | Sold | $85,000 | 0.0% | $70 / Sq Ft |
| 06/29/2018 06/29/18 | Pending | -- | -- | -- |
| 06/29/2018 06/29/18 | For Sale | $85,000 | +14.1% | $70 / Sq Ft |
| 06/01/2017 06/01/17 | Sold | $74,500 | +3.5% | $62 / Sq Ft |
| 04/07/2017 04/07/17 | Sold | $72,000 | -6.5% | $60 / Sq Ft |
| 03/29/2017 03/29/17 | Pending | -- | -- | -- |
| 03/20/2017 03/20/17 | For Sale | $77,000 | -3.6% | $64 / Sq Ft |
| 02/16/2017 02/16/17 | For Sale | $79,900 | +9.5% | $66 / Sq Ft |
| 06/20/2016 06/20/16 | Sold | $73,000 | 0.0% | $60 / Sq Ft |
| 06/01/2016 06/01/16 | Rented | $875 | 0.0% | -- |
| 05/05/2016 05/05/16 | Under Contract | -- | -- | -- |
| 05/01/2016 05/01/16 | Pending | -- | -- | -- |
| 04/28/2016 04/28/16 | For Rent | $875 | 0.0% | -- |
| 02/16/2016 02/16/16 | Rented | $875 | 0.0% | -- |
| 02/12/2016 02/12/16 | For Sale | $75,000 | 0.0% | $62 / Sq Ft |
| 02/10/2016 02/10/16 | Under Contract | -- | -- | -- |
| 11/17/2015 11/17/15 | For Rent | $875 | +2.9% | -- |
| 02/01/2015 02/01/15 | Rented | $850 | 0.0% | -- |
| 01/30/2015 01/30/15 | Sold | $75,500 | 0.0% | $62 / Sq Ft |
| 01/21/2015 01/21/15 | Under Contract | -- | -- | -- |
| 01/20/2015 01/20/15 | Pending | -- | -- | -- |
| 12/05/2014 12/05/14 | For Sale | $79,900 | 0.0% | $66 / Sq Ft |
| 09/24/2014 09/24/14 | For Rent | $850 | -- | -- |
Source: Capital Area Technology & REALTOR® Services (Tallahassee Board of REALTORS®)
Tax History Compared to Growth
Tax History
| Year | Tax Paid | Tax Assessment Tax Assessment Total Assessment is a certain percentage of the fair market value that is determined by local assessors to be the total taxable value of land and additions on the property. | Land | Improvement |
|---|---|---|---|---|
| 2024 | $2,083 | $116,000 | -- | $116,000 |
| 2023 | $1,919 | $95,700 | $0 | $0 |
| 2022 | $1,634 | $87,000 | $0 | $87,000 |
| 2021 | $1,471 | $76,650 | $0 | $76,650 |
| 2020 | $1,380 | $73,000 | $0 | $73,000 |
| 2019 | $1,338 | $70,000 | $0 | $70,000 |
| 2018 | $560 | $62,281 | $0 | $0 |
| 2017 | $560 | $61,000 | $0 | $0 |
| 2016 | $564 | $60,000 | $0 | $0 |
| 2015 | $594 | $60,000 | $0 | $0 |
| 2014 | $594 | $63,000 | $0 | $0 |
Source: Public Records
Agents Affiliated with this Home
-
S
Seller's Agent in 2024
Steve Wright
Investors Realty Of Tallahasse
(850) 510-4312
7 in this area
66 Total Sales
-
Seller's Agent in 2024
Danielle Andrews
Realty One Group Next Gen
(727) 433-2402
24 in this area
311 Total Sales
-
Buyer's Agent in 2024
Kimberly Cohen
Realty One Group Next Gen
(850) 321-0241
3 Total Sales
-
Buyer's Agent in 2024
Tom Hutchinson
Keller Williams Town & Country
(850) 322-4954
10 in this area
94 Total Sales
-
Seller's Agent in 2023
Zhongli Wang
Sunflower Real Estate LLC
(850) 445-0033
6 in this area
166 Total Sales
-
Seller's Agent in 2022
Nadia Spence
Provision Realty, LLC
(954) 328-3281
3 in this area
28 Total Sales
Map
Source: Capital Area Technology & REALTOR® Services (Tallahassee Board of REALTORS®)
MLS Number: 348717
APN: 21-21-32-003-003.0
Disclaimer: Certain information contained herein is derived from information provided by parties other than Homes.com. All information provided is deemed reliable, but is not guaranteed to be accurate and should be independently verified.
![]() IDX information is provided exclusively for personal, non-commercial use, and may not be used for any purpose other than to identify prospective properties consumers may be interested in purchasing.
IDX information is provided exclusively for personal, non-commercial use, and may not be used for any purpose other than to identify prospective properties consumers may be interested in purchasing.
Information is deemed reliable but not guaranteed.
Nearby Homes
- 2738 W Tharpe St Unit 2302
- 2738 W Tharpe St Unit 806
- 2738 W Tharpe St Unit 902
- 2738 W Tharpe St Unit 2101
- 2758 Westbrook Ct
- 1914 Fannie Dr
- 2612 W Tharpe St
- 2197 Del Carmel Way Unit 3
- 2281 Del Carmel Way
- xxxx Hartsfield Rd
- 2228 Del Carmel Way
- 2732 Tess Cir
- 2525 Hartsfield Rd Unit 18
- 2525 Hartsfield Rd Unit 24
- 2525 Hartsfield Rd Unit 9
- 2525 Hartsfield Rd Unit 21
- 2525 Hartsfield Rd Unit 12
- 1573 Blountstown St
- 2332 Talley Ln Unit 1
- 2716 Via Milano Ave Unit A