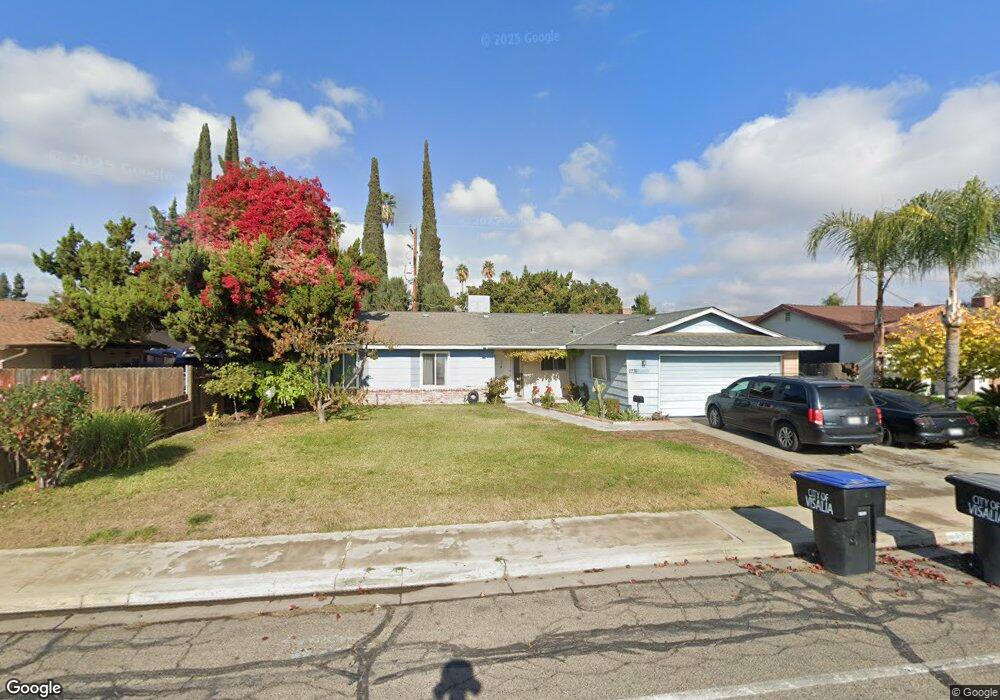
2738 W Whitendale Ave Visalia, CA 93277
Mooney NeighborhoodEstimated Value: $337,663 - $387,000
3
Beds
2
Baths
1,539
Sq Ft
$237/Sq Ft
Est. Value
About This Home
This home is located at 2738 W Whitendale Ave, Visalia, CA 93277 and is currently estimated at $364,666, approximately $236 per square foot. 2738 W Whitendale Ave is a home located in Tulare County with nearby schools including Crestwood Elementary School, La Joya Middle School, and El Diamante High School.
Ownership History
Date
Name
Owned For
Owner Type
Purchase Details
Closed on
Apr 22, 2003
Sold by
Camacho Ana Maria
Bought by
Camacho Roberto
Current Estimated Value
Home Financials for this Owner
Home Financials are based on the most recent Mortgage that was taken out on this home.
Original Mortgage
$98,400
Outstanding Balance
$41,808
Interest Rate
5.72%
Estimated Equity
$322,858
Purchase Details
Closed on
Mar 18, 2003
Sold by
Bush William Walter
Bought by
Camacho Roberto
Home Financials for this Owner
Home Financials are based on the most recent Mortgage that was taken out on this home.
Original Mortgage
$98,400
Outstanding Balance
$41,808
Interest Rate
5.72%
Estimated Equity
$322,858
Purchase Details
Closed on
Mar 17, 2000
Sold by
Bush William W
Bought by
Bush William Walter and Bush Tonia Gates
Purchase Details
Closed on
Mar 25, 1999
Sold by
Bush William W
Bought by
Bush William Walter and Bush Tonia Gates
Create a Home Valuation Report for This Property
The Home Valuation Report is an in-depth analysis detailing your home's value as well as a comparison with similar homes in the area
Home Values in the Area
Average Home Value in this Area
Purchase History
| Date | Buyer | Sale Price | Title Company |
|---|---|---|---|
| Camacho Roberto | -- | Chicago Title Co | |
| Camacho Roberto | $123,000 | Chicago Title Co | |
| Bush William Walter | -- | -- | |
| Bush William Walter | -- | -- |
Source: Public Records
Mortgage History
| Date | Status | Borrower | Loan Amount |
|---|---|---|---|
| Open | Camacho Roberto | $98,400 |
Source: Public Records
Tax History Compared to Growth
Tax History
| Year | Tax Paid | Tax Assessment Tax Assessment Total Assessment is a certain percentage of the fair market value that is determined by local assessors to be the total taxable value of land and additions on the property. | Land | Improvement |
|---|---|---|---|---|
| 2025 | $1,882 | $178,148 | $65,174 | $112,974 |
| 2024 | $1,882 | $174,656 | $63,897 | $110,759 |
| 2023 | $1,831 | $171,233 | $62,645 | $108,588 |
| 2022 | $1,774 | $167,876 | $61,417 | $106,459 |
| 2021 | $1,677 | $164,585 | $60,213 | $104,372 |
| 2020 | $1,660 | $162,898 | $59,596 | $103,302 |
| 2019 | $1,614 | $159,703 | $58,427 | $101,276 |
| 2018 | $1,569 | $156,571 | $57,281 | $99,290 |
| 2017 | $1,554 | $153,501 | $56,158 | $97,343 |
| 2016 | $1,521 | $150,491 | $55,057 | $95,434 |
| 2015 | $1,475 | $148,230 | $54,230 | $94,000 |
| 2014 | $1,475 | $145,327 | $53,168 | $92,159 |
Source: Public Records
Map
Nearby Homes
- 2650 S Linda Vista St
- 2724 S County Center Dr
- 2944 S Verde Vista St
- 2820 W Dorothea Ave
- 2316 S Verde Vista St
- 2318 S Terrace St
- 2245 S Sallee St
- 2532 W Chestnut Ct
- 3116 W Beech Ave
- 2219 S Linda Vista St
- 2135 S Woodland St
- 3045 W Victor Ave
- 4301 S University St
- 0 S Silvervale Unit 231829
- 2741 W Mission Ct
- 0 S Mooney Blvd
- 2738 S Fairway Ct
- 2301 S Divisadero St Unit 8
- 3504 W Cutler Ave
- 2750 W Whitendale Ave
- 2726 W Whitendale Ave
- 2733 W Country Ave
- 2745 W Country Ave
- 2723 W Country Ave
- 2810 W Whitendale Ave
- 2714 W Whitendale Ave
- 2805 W Evergreen Ave
- 2743 W Whitendale Ave
- 2731 W Whitendale Ave
- 2713 W Country Ave
- 2805 W Whitendale Ave
- 2721 W Whitendale Ave
- 2822 W Whitendale Ave
- 2704 W Whitendale Ave
- 2819 W Evergreen Ave
- 2815 W Whitendale Ave
- 2701 W Country Ave
- 2709 W Whitendale Ave
- 2724 W Country Ave