Estimated Value: $262,000 - $401,507
4
Beds
4
Baths
2,520
Sq Ft
$140/Sq Ft
Est. Value
About This Home
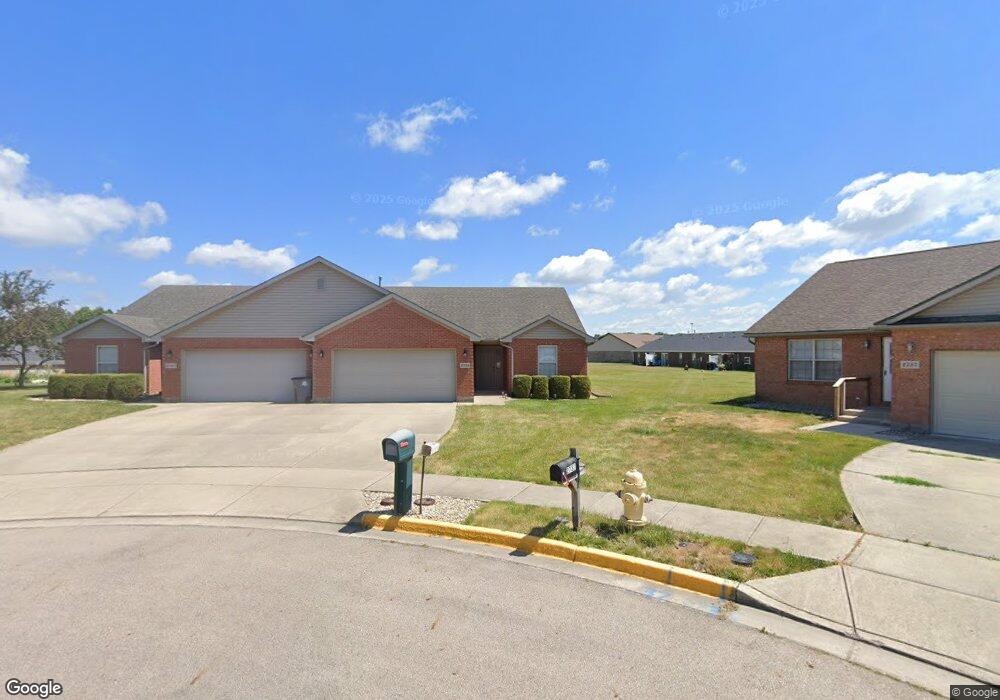
This home is located at 2739 Fairview Ct, Troy, OH 45373 and is currently estimated at $351,877, approximately $139 per square foot. 2739 Fairview Ct is a home located in Miami County with nearby schools including Hook Elementary School, Troy Junior High School, and Van Cleve Elementary School.
Ownership History
Date
Name
Owned For
Owner Type
Purchase Details
Closed on
Oct 11, 2024
Sold by
May Cory J and May Karen A
Bought by
May Rental Properties Llc
Current Estimated Value
Purchase Details
Closed on
Jun 27, 2016
Sold by
May Rentals Properties Llc
Bought by
May Cory and May Karen
Purchase Details
Closed on
Jul 15, 2008
Sold by
May Cory J and May Karen A
Bought by
May Rental Properties Llc
Purchase Details
Closed on
May 9, 2003
Sold by
Mosler Susanne K
Bought by
May Cory J and May Karen A
Home Financials for this Owner
Home Financials are based on the most recent Mortgage that was taken out on this home.
Original Mortgage
$169,600
Interest Rate
6.02%
Mortgage Type
New Conventional
Purchase Details
Closed on
Nov 12, 2002
Sold by
Upnorth Homes Inc
Bought by
Liv Mosier Susanne K and Liv Susanne K Mosier Revocable
Purchase Details
Closed on
Apr 12, 1999
Sold by
Balogh Joseph J and Balogh Dolores A
Bought by
Upnorth Homes Inc
Create a Home Valuation Report for This Property
The Home Valuation Report is an in-depth analysis detailing your home's value as well as a comparison with similar homes in the area
Home Values in the Area
Average Home Value in this Area
Purchase History
| Date | Buyer | Sale Price | Title Company |
|---|---|---|---|
| May Rental Properties Llc | -- | None Listed On Document | |
| May Cory | -- | National Link | |
| May Rental Properties Llc | -- | -- | |
| May Cory J | $212,000 | -- | |
| Liv Mosier Susanne K | -- | -- | |
| Upnorth Homes Inc | $25,000 | -- |
Source: Public Records
Mortgage History
| Date | Status | Borrower | Loan Amount |
|---|---|---|---|
| Previous Owner | Upnorth Homes Inc | $169,600 |
Source: Public Records
Tax History
| Year | Tax Paid | Tax Assessment Tax Assessment Total Assessment is a certain percentage of the fair market value that is determined by local assessors to be the total taxable value of land and additions on the property. | Land | Improvement |
|---|---|---|---|---|
| 2024 | $4,052 | $89,820 | $19,570 | $70,250 |
| 2023 | $3,422 | $89,820 | $19,570 | $70,250 |
| 2022 | $2,857 | $89,820 | $19,570 | $70,250 |
| 2021 | $2,313 | $69,090 | $15,050 | $54,040 |
| 2020 | $2,317 | $69,090 | $15,050 | $54,040 |
| 2019 | $2,338 | $69,090 | $15,050 | $54,040 |
| 2018 | $2,235 | $63,530 | $15,050 | $48,480 |
| 2017 | $2,257 | $63,530 | $15,050 | $48,480 |
| 2016 | $2,256 | $63,530 | $15,050 | $48,480 |
| 2015 | $2,355 | $63,530 | $15,050 | $48,480 |
| 2014 | $2,355 | $63,530 | $15,050 | $48,480 |
| 2013 | $2,370 | $63,530 | $15,050 | $48,480 |
Source: Public Records
Map
Nearby Homes
- 2706 Executive Dr
- 2508 Foxchase Ct W
- 2472 Thornhill Dr
- 541 Northpoint Ct
- 2273 Lytle Rd
- 2279 Lytle Rd
- 2311 Lytle Rd
- 2319 Lytle Rd
- 2359 Lytle Rd
- 2659 Stonebridge
- 673 Sedgwick Way
- 2365 Murphy Ln W
- 2290 Murphy Ln E
- 2391 Girard Ln W
- 1137 Red Maple Dr
- 1360 Croydon Rd
- 1112 Red Maple Dr
- 3318 Heatherstone Dr
- 45 Colony Park Dr Unit 4
- 1020 W Main St
- 2750 Fairview Ct
- 2735 Fairview Ct
- 2714 Fairmont Ct
- 2746 Fairview Ct
- 2731 Fairview Ct
- 2712 Fairmont Ct
- 125 Carriage Crossing Way
- 135 Carriage Crossing Way
- 2744 Fairview Ct
- 115 Carriage Crossing Way
- 145 Carriage Crossing Way
- 2710 Fairmont Ct
- 2742 Fairview Ct
- 75 Carriage Crossing Way
- 155 Carriage Crossing Way
- 2727 Fairview Ct
- 65 Carriage Crossing Way
- 165 Carriage Crossing Way
- 2708 Fairmont Ct
- 2738 Fairview Ct
Your Personal Tour Guide
Ask me questions while you tour the home.