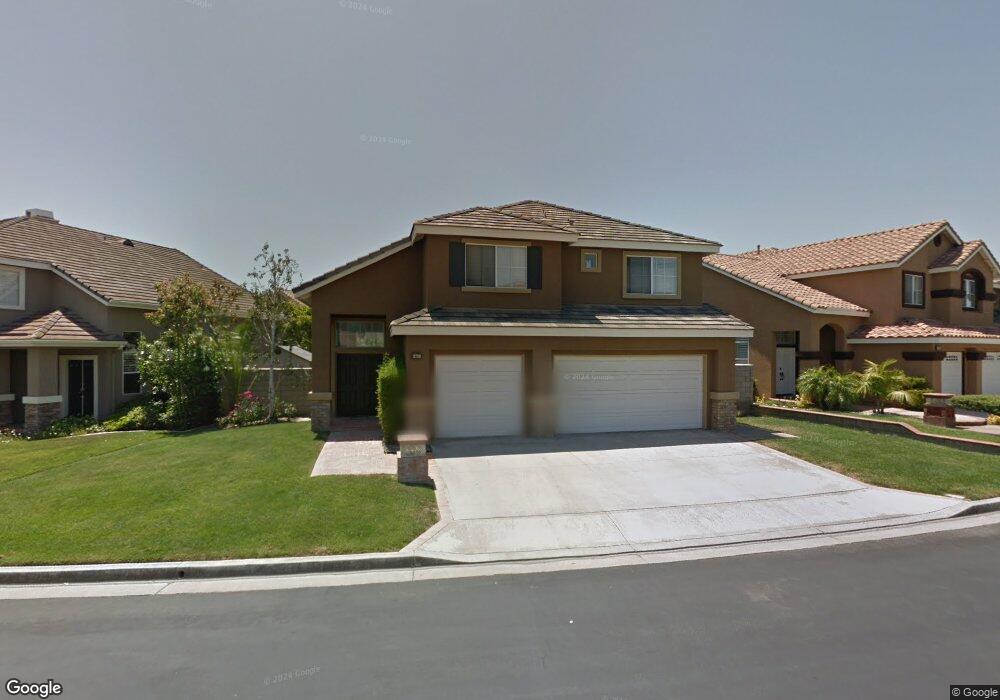
2739 N Hampton St Orange, CA 92867
Estimated Value: $1,364,273 - $1,550,000
4
Beds
3
Baths
1,979
Sq Ft
$728/Sq Ft
Est. Value
About This Home
This home is located at 2739 N Hampton St, Orange, CA 92867 and is currently estimated at $1,440,318, approximately $727 per square foot. 2739 N Hampton St is a home located in Orange County with nearby schools including Nohl Canyon Elementary School, Cerro Villa Middle School, and Villa Park High School.
Ownership History
Date
Name
Owned For
Owner Type
Purchase Details
Closed on
Aug 16, 2024
Sold by
Patel Pravin M and Patel Dharmishtha P
Bought by
Pravin And Dharmishtha Patel Revocable Living and Patel
Current Estimated Value
Purchase Details
Closed on
May 16, 2002
Sold by
Faulds David J and Faulds Beverly A
Bought by
Patel Pravin M and Patel Dharmishtha P
Home Financials for this Owner
Home Financials are based on the most recent Mortgage that was taken out on this home.
Original Mortgage
$300,700
Interest Rate
6.86%
Purchase Details
Closed on
May 8, 1995
Sold by
Pacific Ridge Partners
Bought by
Faulds David J and Faulds Beverly A
Home Financials for this Owner
Home Financials are based on the most recent Mortgage that was taken out on this home.
Original Mortgage
$203,150
Interest Rate
7.88%
Create a Home Valuation Report for This Property
The Home Valuation Report is an in-depth analysis detailing your home's value as well as a comparison with similar homes in the area
Home Values in the Area
Average Home Value in this Area
Purchase History
| Date | Buyer | Sale Price | Title Company |
|---|---|---|---|
| Pravin And Dharmishtha Patel Revocable Living | -- | Southcoast Title | |
| Patel Pravin M | $460,000 | -- | |
| Faulds David J | $235,000 | First American Title Ins |
Source: Public Records
Mortgage History
| Date | Status | Borrower | Loan Amount |
|---|---|---|---|
| Previous Owner | Patel Pravin M | $300,700 | |
| Previous Owner | Faulds David J | $203,150 |
Source: Public Records
Tax History
| Year | Tax Paid | Tax Assessment Tax Assessment Total Assessment is a certain percentage of the fair market value that is determined by local assessors to be the total taxable value of land and additions on the property. | Land | Improvement |
|---|---|---|---|---|
| 2025 | $7,362 | $679,550 | $334,714 | $344,836 |
| 2024 | $7,362 | $666,226 | $328,151 | $338,075 |
| 2023 | $7,199 | $653,163 | $321,716 | $331,447 |
| 2022 | $7,058 | $640,356 | $315,407 | $324,949 |
| 2021 | $6,860 | $627,800 | $309,222 | $318,578 |
| 2020 | $6,796 | $621,363 | $306,051 | $315,312 |
| 2019 | $6,709 | $609,180 | $300,050 | $309,130 |
| 2018 | $6,606 | $597,236 | $294,167 | $303,069 |
| 2017 | $6,330 | $585,526 | $288,399 | $297,127 |
| 2016 | $6,206 | $574,046 | $282,745 | $291,301 |
| 2015 | $6,115 | $565,424 | $278,498 | $286,926 |
| 2014 | $5,983 | $554,349 | $273,043 | $281,306 |
Source: Public Records
Map
Nearby Homes
- 2772 N Blackburn Dr Unit A
- 2811 N Roxbury St
- 645 S Andover Dr
- 4204 E Townsend Ave
- 9312 Smoketree Ln
- 9451 Brewer Way
- 415 S Brook Ln
- 5598 E Stetson Ct Unit 22
- 5447 E Willowick Cir
- 9531 Lemon St
- 19272 Mesa Dr
- 240 S Orange Acres Dr
- 0 Cannon St
- 18811 Ridgeview Cir
- 18262 Pamela Place
- 5810 E Mountain Loop Trail Unit 35
- 317 S Vista Del Canon
- 2236 N Wisteria Ln Unit 40
- 2533 N Shady Forest Ln
- 5573 E Vista Del Rio
- 2749 N Hampton St
- 2709 N Hampton St
- 2704 N Kent St
- 2759 N Hampton St
- 2708 N Kent St
- 2677 N Hampton St
- 2744 N Hampton St
- 2738 N Hampton St
- 2752 N Hampton St
- 2734 N Hampton St
- 2702 N Kent St
- 2767 N Hampton St
- 2764 N Hampton St
- 2665 N Bentley St
- 2712 N Kent St
- 2768 N Hampton St
- 2728 N Hampton St
- 4704 E Ashford Ave
- 2671 N Bentley St
- 2748 N Coventry St
Your Personal Tour Guide
Ask me questions while you tour the home.