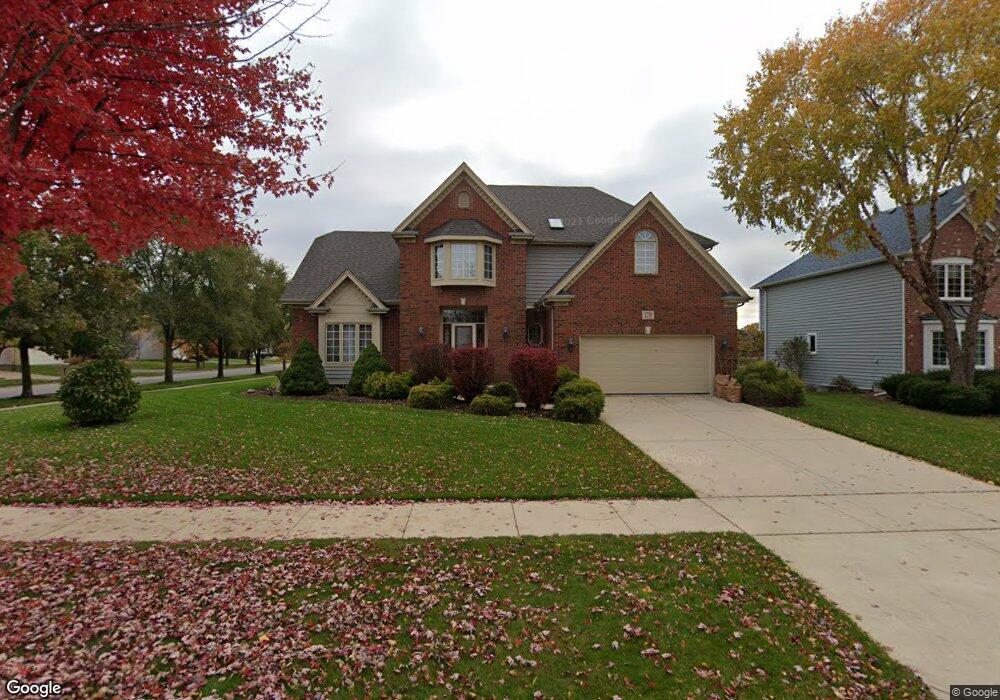
2739 Salix Cir Naperville, IL 60564
Brook Crossing NeighborhoodEstimated Value: $673,064 - $758,000
--
Bed
1
Bath
3,115
Sq Ft
$235/Sq Ft
Est. Value
About This Home
This home is located at 2739 Salix Cir, Naperville, IL 60564 and is currently estimated at $733,016, approximately $235 per square foot. 2739 Salix Cir is a home located in Will County with nearby schools including Robert Clow Elementary School, Ellsworth Elementary School, and Gordon Gregory Middle School.
Ownership History
Date
Name
Owned For
Owner Type
Purchase Details
Closed on
Sep 29, 2017
Sold by
Nguyen Binh Ke and Nguyen Thuy Thu
Bought by
Binh Ke Nguyen and Binh Thuy Thu
Current Estimated Value
Purchase Details
Closed on
Jul 24, 1996
Sold by
Classic Custom Homes Inc
Bought by
Nguyen Binh Ke and Nguyen Thuy Thu
Home Financials for this Owner
Home Financials are based on the most recent Mortgage that was taken out on this home.
Original Mortgage
$207,000
Outstanding Balance
$15,086
Interest Rate
8.33%
Estimated Equity
$717,930
Purchase Details
Closed on
Mar 12, 1996
Sold by
Depaulo Builders Inc
Bought by
Classic Custom Homes Inc
Home Financials for this Owner
Home Financials are based on the most recent Mortgage that was taken out on this home.
Original Mortgage
$225,000
Interest Rate
7.06%
Create a Home Valuation Report for This Property
The Home Valuation Report is an in-depth analysis detailing your home's value as well as a comparison with similar homes in the area
Home Values in the Area
Average Home Value in this Area
Purchase History
| Date | Buyer | Sale Price | Title Company |
|---|---|---|---|
| Binh Ke Nguyen | -- | None Available | |
| Nguyen Binh Ke | $304,000 | -- | |
| Classic Custom Homes Inc | $75,000 | Chicago Title Insurance Co |
Source: Public Records
Mortgage History
| Date | Status | Borrower | Loan Amount |
|---|---|---|---|
| Open | Nguyen Binh Ke | $207,000 | |
| Previous Owner | Classic Custom Homes Inc | $225,000 |
Source: Public Records
Tax History Compared to Growth
Tax History
| Year | Tax Paid | Tax Assessment Tax Assessment Total Assessment is a certain percentage of the fair market value that is determined by local assessors to be the total taxable value of land and additions on the property. | Land | Improvement |
|---|---|---|---|---|
| 2024 | $12,798 | $211,394 | $48,979 | $162,415 |
| 2023 | $12,798 | $186,744 | $43,268 | $143,476 |
| 2022 | $11,981 | $176,359 | $40,931 | $135,428 |
| 2021 | $11,433 | $167,961 | $38,982 | $128,979 |
| 2020 | $11,573 | $165,299 | $38,364 | $126,935 |
| 2019 | $11,375 | $160,641 | $37,283 | $123,358 |
| 2018 | $10,969 | $152,432 | $36,462 | $115,970 |
| 2017 | $11,721 | $160,633 | $35,522 | $125,111 |
| 2016 | $11,700 | $157,175 | $34,757 | $122,418 |
| 2015 | $11,674 | $151,130 | $33,420 | $117,710 |
| 2014 | $11,674 | $147,916 | $33,420 | $114,496 |
| 2013 | $11,674 | $147,916 | $33,420 | $114,496 |
Source: Public Records
Map
Nearby Homes
- 2949 Brossman St
- 3004 Bennett Dr
- 2636 Salix Cir
- 1305 Morningstar Ct Unit 1A
- 28W555 Leverenz Rd
- 2741 Gateshead Dr
- 2207 Sisters Ave
- 1123 Thackery Ln
- 3432 Caine Dr
- 1134 Gateshead Dr
- 1329 Neskola Ct
- 1116 Hollingswood Ave
- 1321 Galena Ct
- 2301 Mecan Dr
- 3616 Eliot Ln
- 2736 Bluewater Cir
- 3508 Tussell St
- 945 Winners Cup Ct Unit 945
- 2543 Dewes Ln
- 2866 Stonewater Dr Unit 102
- 2735 Salix Cir
- 2731 Salix Cir
- 2779 Willow Ridge Dr
- 2808 Willow Ridge Dr
- 2804 Willow Ridge Dr
- 2812 Willow Ridge Dr
- 2784 Willow Ridge Dr
- 2720 Salix Cir
- 2816 Willow Ridge Dr
- 2780 Willow Ridge Dr
- 2775 Willow Ridge Dr
- 2727 Salix Cir
- 2716 Salix Cir
- 2776 Willow Ridge Dr
- 2820 Willow Ridge Dr
- 28W492 95th St
- 2771 Willow Ridge Dr
- 2723 Salix Cir
- 2712 Salix Cir
- 2719 Salix Cir