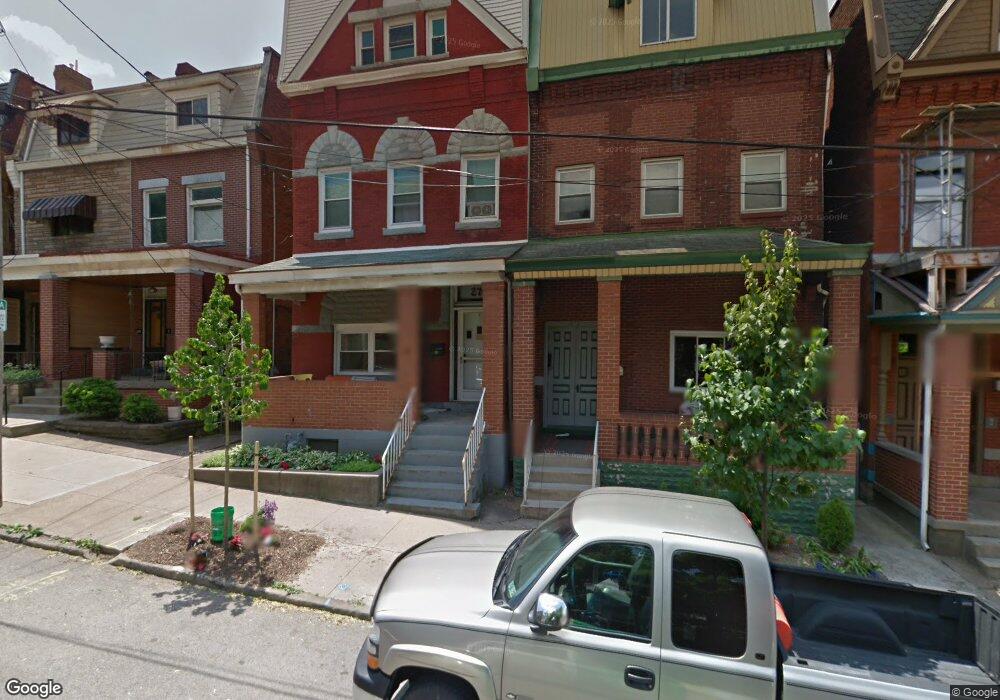
274 Fisk St Pittsburgh, PA 15201
Central Lawrenceville NeighborhoodEstimated Value: $428,000 - $757,000
4
Beds
2
Baths
2,646
Sq Ft
$231/Sq Ft
Est. Value
About This Home
This home is located at 274 Fisk St, Pittsburgh, PA 15201 and is currently estimated at $610,060, approximately $230 per square foot. 274 Fisk St is a home located in Allegheny County with nearby schools including Pittsburgh Arsenal K-5, Pittsburgh Arsenal 6-8, and Pittsburgh Milliones 6-12.
Ownership History
Date
Name
Owned For
Owner Type
Purchase Details
Closed on
Sep 29, 2009
Sold by
Argenas Keith M and Argenas Rose M
Bought by
Gaugler Jonathan G and Gaugler Rebecca U
Current Estimated Value
Home Financials for this Owner
Home Financials are based on the most recent Mortgage that was taken out on this home.
Original Mortgage
$138,000
Outstanding Balance
$90,387
Interest Rate
5.14%
Mortgage Type
New Conventional
Estimated Equity
$519,673
Create a Home Valuation Report for This Property
The Home Valuation Report is an in-depth analysis detailing your home's value as well as a comparison with similar homes in the area
Home Values in the Area
Average Home Value in this Area
Purchase History
| Date | Buyer | Sale Price | Title Company |
|---|---|---|---|
| Gaugler Jonathan G | $178,000 | -- |
Source: Public Records
Mortgage History
| Date | Status | Borrower | Loan Amount |
|---|---|---|---|
| Open | Gaugler Jonathan G | $138,000 |
Source: Public Records
Tax History Compared to Growth
Tax History
| Year | Tax Paid | Tax Assessment Tax Assessment Total Assessment is a certain percentage of the fair market value that is determined by local assessors to be the total taxable value of land and additions on the property. | Land | Improvement |
|---|---|---|---|---|
| 2025 | $3,262 | $141,600 | $37,500 | $104,100 |
| 2024 | $3,262 | $141,600 | $37,500 | $104,100 |
| 2023 | $3,262 | $141,600 | $37,500 | $104,100 |
| 2022 | $3,220 | $141,600 | $37,500 | $104,100 |
| 2021 | $3,220 | $141,600 | $37,500 | $104,100 |
| 2020 | $3,204 | $141,600 | $37,500 | $104,100 |
| 2019 | $3,204 | $141,600 | $37,500 | $104,100 |
| 2018 | $2,478 | $141,600 | $37,500 | $104,100 |
| 2017 | $3,204 | $141,600 | $37,500 | $104,100 |
| 2016 | $670 | $141,600 | $37,500 | $104,100 |
| 2015 | $670 | $141,600 | $37,500 | $104,100 |
| 2014 | $3,134 | $141,600 | $37,500 | $104,100 |
Source: Public Records
Map
Nearby Homes