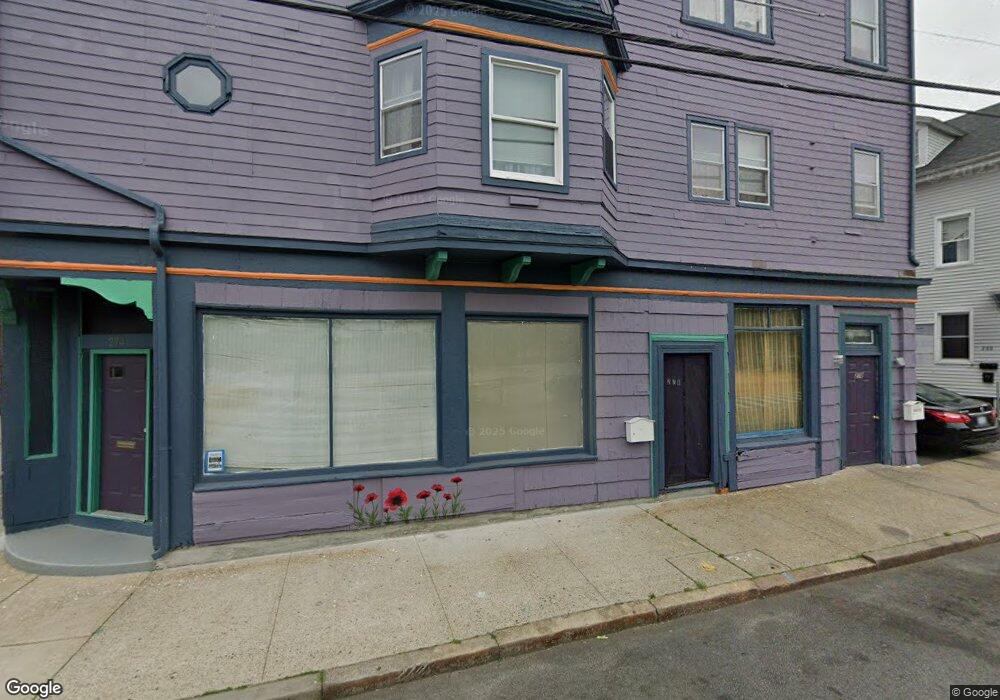
274 Plain St Providence, RI 02905
Upper South Providence NeighborhoodEstimated Value: $306,038 - $639,000
4
Beds
4
Baths
3,489
Sq Ft
$147/Sq Ft
Est. Value
About This Home
This home is located at 274 Plain St, Providence, RI 02905 and is currently estimated at $512,010, approximately $146 per square foot. 274 Plain St is a home located in Providence County with nearby schools including Asa Messer Elementary School, Charles N. Fortes Elementary School, and Robert L. Bailey IV Elementary.
Ownership History
Date
Name
Owned For
Owner Type
Purchase Details
Closed on
Jul 11, 2017
Sold by
Wilson Frank and Barros Donetta
Bought by
Cynara-Barros Jazandra
Current Estimated Value
Home Financials for this Owner
Home Financials are based on the most recent Mortgage that was taken out on this home.
Original Mortgage
$137,464
Outstanding Balance
$114,122
Interest Rate
3.95%
Mortgage Type
FHA
Estimated Equity
$397,888
Purchase Details
Closed on
Sep 18, 2015
Sold by
Ri Hsng & Mtg Fin Corp and Providence Town Of
Bought by
Barros Manuel
Create a Home Valuation Report for This Property
The Home Valuation Report is an in-depth analysis detailing your home's value as well as a comparison with similar homes in the area
Home Values in the Area
Average Home Value in this Area
Purchase History
| Date | Buyer | Sale Price | Title Company |
|---|---|---|---|
| Cynara-Barros Jazandra | $140,000 | -- | |
| Barros Manuel | -- | -- |
Source: Public Records
Mortgage History
| Date | Status | Borrower | Loan Amount |
|---|---|---|---|
| Open | Cynara-Barros Jazandra | $137,464 |
Source: Public Records
Tax History Compared to Growth
Tax History
| Year | Tax Paid | Tax Assessment Tax Assessment Total Assessment is a certain percentage of the fair market value that is determined by local assessors to be the total taxable value of land and additions on the property. | Land | Improvement |
|---|---|---|---|---|
| 2025 | $4,195 | $555,600 | $98,100 | $457,500 |
| 2024 | $6,553 | $357,100 | $54,900 | $302,200 |
| 2023 | $6,553 | $357,100 | $54,900 | $302,200 |
| 2022 | $6,356 | $357,100 | $54,900 | $302,200 |
| 2021 | $4,264 | $173,600 | $23,900 | $149,700 |
| 2020 | $4,264 | $173,600 | $23,900 | $149,700 |
| 2019 | $4,264 | $173,600 | $23,900 | $149,700 |
| 2018 | $4,094 | $128,100 | $21,700 | $106,400 |
| 2017 | $4,094 | $128,100 | $21,700 | $106,400 |
| 2016 | $4,094 | $128,100 | $21,700 | $106,400 |
| 2015 | $3,568 | $107,800 | $21,700 | $86,100 |
| 2014 | $3,638 | $107,800 | $21,700 | $86,100 |
| 2013 | $3,638 | $107,800 | $21,700 | $86,100 |
Source: Public Records
Map
Nearby Homes