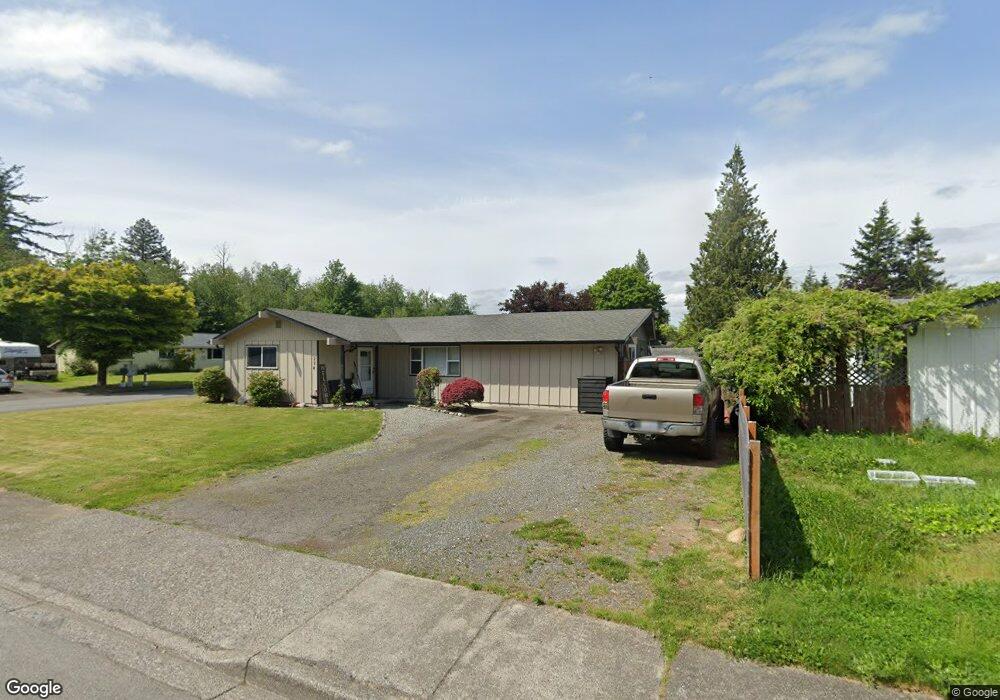
274 Pollman Cir Lynden, WA 98264
Estimated Value: $452,000 - $554,000
4
Beds
1
Bath
1,314
Sq Ft
$372/Sq Ft
Est. Value
About This Home
This home is located at 274 Pollman Cir, Lynden, WA 98264 and is currently estimated at $489,430, approximately $372 per square foot. 274 Pollman Cir is a home located in Whatcom County with nearby schools including Irene Reither Elementary School, Meridian Middle School, and Meridian High School.
Ownership History
Date
Name
Owned For
Owner Type
Purchase Details
Closed on
May 5, 2006
Sold by
Briones Joanna L
Bought by
Briones Benancio L
Current Estimated Value
Home Financials for this Owner
Home Financials are based on the most recent Mortgage that was taken out on this home.
Original Mortgage
$164,050
Outstanding Balance
$94,466
Interest Rate
6.3%
Mortgage Type
Fannie Mae Freddie Mac
Estimated Equity
$394,964
Purchase Details
Closed on
Dec 17, 2004
Sold by
Briones Benancio L
Bought by
Briones Benancio L and Briones Joanna L
Home Financials for this Owner
Home Financials are based on the most recent Mortgage that was taken out on this home.
Original Mortgage
$115,000
Interest Rate
5.76%
Mortgage Type
New Conventional
Purchase Details
Closed on
Jun 25, 1999
Sold by
Irwin Elissa G
Bought by
Briones Benancio L
Home Financials for this Owner
Home Financials are based on the most recent Mortgage that was taken out on this home.
Original Mortgage
$95,853
Interest Rate
7.2%
Mortgage Type
FHA
Create a Home Valuation Report for This Property
The Home Valuation Report is an in-depth analysis detailing your home's value as well as a comparison with similar homes in the area
Home Values in the Area
Average Home Value in this Area
Purchase History
| Date | Buyer | Sale Price | Title Company |
|---|---|---|---|
| Briones Benancio L | -- | Whatcom Land Title | |
| Briones Benancio L | -- | Stewart Title Company | |
| Briones Benancio L | $96,000 | Island Title |
Source: Public Records
Mortgage History
| Date | Status | Borrower | Loan Amount |
|---|---|---|---|
| Open | Briones Benancio L | $164,050 | |
| Closed | Briones Benancio L | $115,000 | |
| Closed | Briones Benancio L | $95,853 |
Source: Public Records
Tax History Compared to Growth
Tax History
| Year | Tax Paid | Tax Assessment Tax Assessment Total Assessment is a certain percentage of the fair market value that is determined by local assessors to be the total taxable value of land and additions on the property. | Land | Improvement |
|---|---|---|---|---|
| 2024 | $3,180 | $408,098 | $218,250 | $189,848 |
| 2023 | $3,180 | $407,546 | $225,000 | $182,546 |
| 2022 | $2,753 | $330,752 | $162,045 | $168,707 |
| 2021 | $2,690 | $273,346 | $133,920 | $139,426 |
| 2020 | $2,404 | $244,064 | $119,574 | $124,490 |
| 2019 | $2,107 | $218,805 | $107,199 | $111,606 |
| 2018 | $2,425 | $209,620 | $102,699 | $106,921 |
| 2017 | $2,219 | $183,700 | $90,000 | $93,700 |
| 2016 | $2,034 | $177,854 | $78,325 | $99,529 |
| 2015 | $1,959 | $162,210 | $72,475 | $89,735 |
| 2014 | -- | $151,437 | $67,275 | $84,162 |
| 2013 | -- | $144,623 | $65,000 | $79,623 |
Source: Public Records
Map
Nearby Homes
- 6818 Vail Dr
- 6830 Vail Dr
- 6852 Dutch Haven Dr
- 0 Old Guide Rd
- 7062 Guide Meridian Rd Unit 26
- 271 E Bartlett Rd
- 6864 Blumefield Dr
- 361 W Wiser Lake Rd
- 6732 La Bello Dr
- 6037 Old Guide Rd
- 6812 Golf View Dr Unit A
- 6917 Red Ridge Dr
- 490 W Laurel Rd
- 7025 Hannegan Rd
- 918 Citadel Dr
- 787 E Wiser Lake Rd
- 765 van Dyk Rd
- 7343 Hannegan Rd Unit 2
- 1257 Lattimore Rd
- 351 W Silverado Ct
- 276 Pollman Cir
- 264 Pollman Cir
- 6818 Braker Way
- 265 Pollman Cir
- 278 Pollman Cir
- 267 Pollman Cir
- 273 Pollman Cir
- 6824 Braker Way
- 263 Pollman Cir
- 269 Pollman Cir
- 277 Pollman Cir
- 280 Pollman Cir
- 261 Pollman Cir
- 6830 Braker Way
- 271 Pollman Cir
- 6813 Braker Way
- 279 Pollman Cir
- 259 Pollman Cir
- 6825 Braker Way
- 282 Pollman Cir