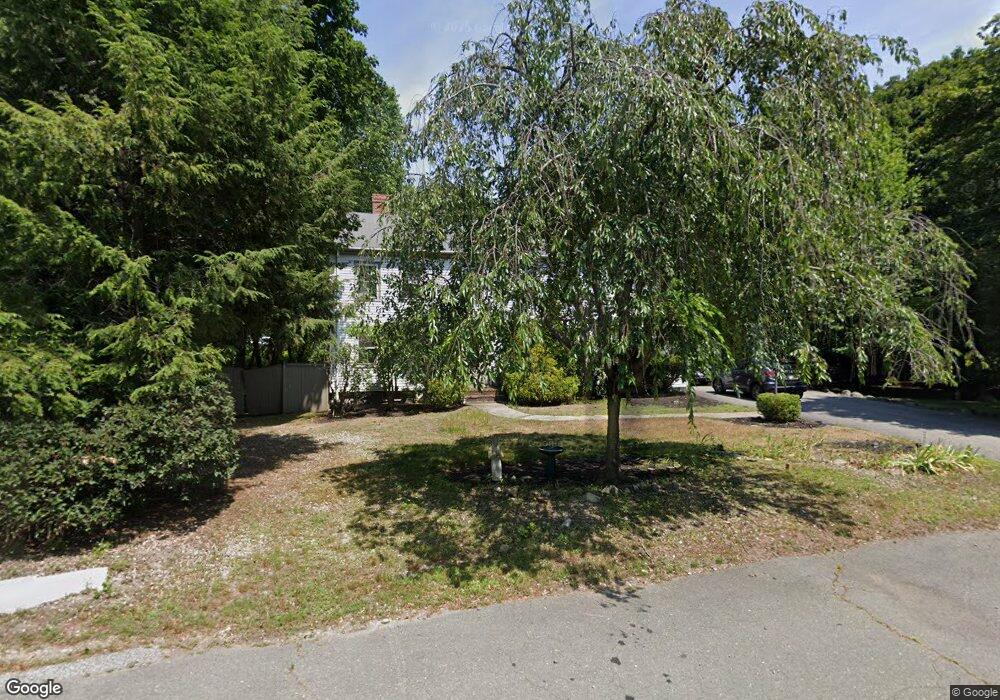
274 Salem St Unit 274 Lynnfield, MA 01940
Estimated Value: $1,024,000 - $1,250,000
2
Beds
1
Bath
2,000
Sq Ft
$574/Sq Ft
Est. Value
About This Home
This home is located at 274 Salem St Unit 274, Lynnfield, MA 01940 and is currently estimated at $1,147,528, approximately $573 per square foot. 274 Salem St Unit 274 is a home located in Essex County with nearby schools including Pickering Middle School, Lynnfield High School, and Odyssey Day School.
Ownership History
Date
Name
Owned For
Owner Type
Purchase Details
Closed on
May 11, 2023
Sold by
Obrien Judith C
Bought by
Judith C Obrien T C and Judith Obrien
Current Estimated Value
Purchase Details
Closed on
Dec 15, 2000
Sold by
Defeo Janine
Bought by
Obrien Judith C
Create a Home Valuation Report for This Property
The Home Valuation Report is an in-depth analysis detailing your home's value as well as a comparison with similar homes in the area
Home Values in the Area
Average Home Value in this Area
Purchase History
| Date | Buyer | Sale Price | Title Company |
|---|---|---|---|
| Judith C Obrien T C | -- | None Available | |
| Obrien Judith C | $42,750 | -- |
Source: Public Records
Mortgage History
| Date | Status | Borrower | Loan Amount |
|---|---|---|---|
| Previous Owner | Obrien Judith C | $650,000 | |
| Previous Owner | Obrien Judith C | $200,000 |
Source: Public Records
Tax History Compared to Growth
Tax History
| Year | Tax Paid | Tax Assessment Tax Assessment Total Assessment is a certain percentage of the fair market value that is determined by local assessors to be the total taxable value of land and additions on the property. | Land | Improvement |
|---|---|---|---|---|
| 2025 | $10,022 | $949,100 | $430,100 | $519,000 |
| 2024 | $9,516 | $905,400 | $409,600 | $495,800 |
| 2023 | $8,828 | $781,200 | $340,800 | $440,400 |
| 2022 | $8,166 | $681,100 | $308,800 | $372,300 |
| 2021 | $8,464 | $637,800 | $286,400 | $351,400 |
| 2020 | $8,508 | $611,200 | $258,900 | $352,300 |
| 2019 | $8,150 | $585,900 | $233,600 | $352,300 |
| 2018 | $8,062 | $585,900 | $233,600 | $352,300 |
| 2017 | $7,787 | $565,100 | $212,800 | $352,300 |
| 2016 | $7,976 | $550,100 | $212,800 | $337,300 |
| 2015 | $7,646 | $527,700 | $190,400 | $337,300 |
Source: Public Records
Map
Nearby Homes