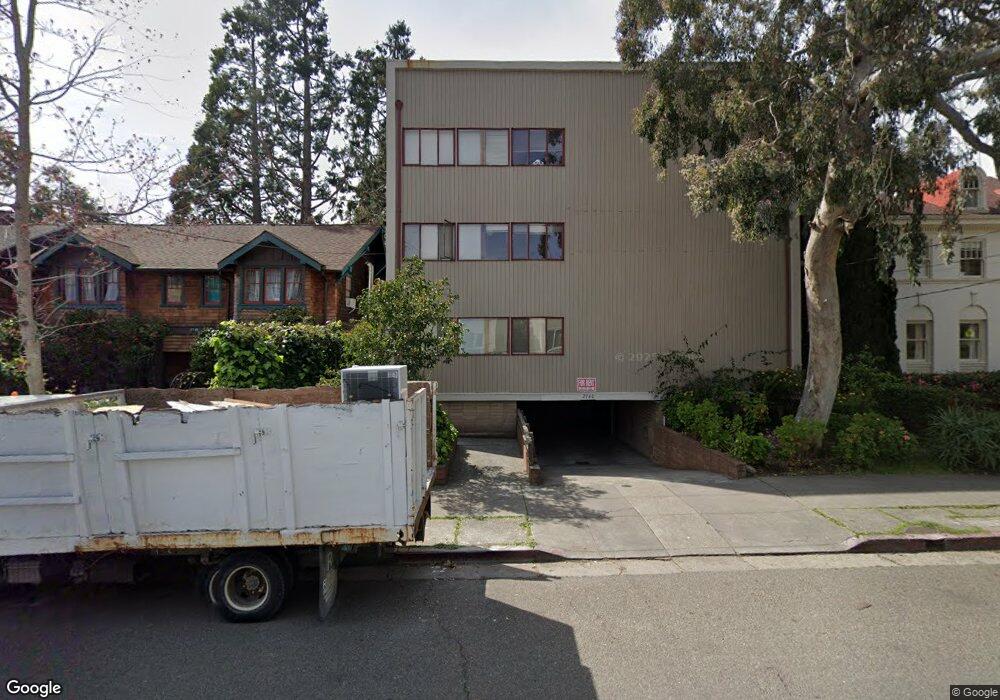
2740 College Ave Berkeley, CA 94705
Elmwood NeighborhoodAbout This Home
Commuter friendly by foot, bike, bus or car. Within a couple blocks of coffee houses, bookstores and restaurants. 1/2 block from AC Transit 51B line, which serves both Rockridge and Downtown Berkeley BART. An 8 min. bike ride to downtown Berkeley or Rockridge shopping areas.
Short walk to UC Berkeley.
The building manager lives on the property and is available for issues that arise.
Home Values in the Area
Average Home Value in this Area
Property History
We collect this data history from publicly available records. To have your information removed, we recommend requesting removal directly through your county’s website.
| Date | Event | Price | List to Sale | Price per Sq Ft |
|---|---|---|---|---|
| 10/04/2025 10/04/25 | Off Market | $2,695 | -- | -- |
| 05/15/2025 05/15/25 | Price Changed | $2,695 | -3.6% | $5 / Sq Ft |
| 03/17/2025 03/17/25 | For Rent | $2,795 | 0.0% | -- |
| 04/14/2024 04/14/24 | Price Changed | $2,795 | -3.5% | $5 / Sq Ft |
| 03/09/2024 03/09/24 | Price Changed | $2,895 | +15.8% | $5 / Sq Ft |
| 03/09/2024 03/09/24 | Price Changed | $2,500 | -7.2% | $5 / Sq Ft |
| 03/08/2024 03/08/24 | For Rent | $2,695 | -- | -- |
Tax History
We collect this data history from publicly available records. To have your information removed, we recommend requesting removal directly through your county’s website.
| Year | Tax Paid | Tax Assessment Tax Assessment Total Assessment is a certain percentage of the fair market value that is determined by local assessors to be the total taxable value of land and additions on the property. | Land | Improvement |
|---|---|---|---|---|
| 2025 | $72,099 | $3,937,726 | $984,431 | $2,953,295 |
| 2024 | $72,099 | $3,860,526 | $965,131 | $2,895,395 |
| 2023 | $70,491 | $3,784,853 | $946,213 | $2,838,640 |
| 2022 | $68,936 | $3,710,649 | $927,662 | $2,782,987 |
| 2021 | $68,914 | $3,637,914 | $909,478 | $2,728,436 |
| 2020 | $64,407 | $3,604,411 | $900,156 | $2,704,255 |
| 2019 | $60,958 | $3,532,929 | $882,513 | $2,650,416 |
| 2018 | $59,780 | $3,463,740 | $865,216 | $2,598,524 |
| 2017 | $57,691 | $3,395,904 | $848,257 | $2,547,647 |
| 2016 | $55,320 | $3,329,394 | $831,629 | $2,497,765 |
| 2015 | $54,517 | $3,279,454 | $819,144 | $2,460,310 |
| 2014 | $54,222 | $3,215,909 | $803,100 | $2,412,809 |
Map
- 2715 Benvenue Ave
- 2610 College Ave
- 2817 Palm Ct
- 2525 Ashby Ave Unit 2
- 2601 College Ave Unit 108
- 2601 College Ave Unit 208
- 2953 Hillegass Ave
- 2811 Telegraph Ave
- 2638 Warring St Unit A
- 2732 Parker St
- 2614 Warring St Unit 6
- 2702 Dana St
- 2917 Telegraph Ave
- 2909 Forest Ave
- 2509 Dwight Way
- 2550 Dana St Unit 5F
- 2550 Dana St Unit 2F
- 2714 Woolsey St
- 2243 Ashby Ave
- 2529 Ellsworth St
- 2799 Benvenue Ave
- 2793 Benvenue Ave
- 2641 Stuart St
- 2735 Benvenue Ave
- 2801 Benvenue Ave
- 2643 Stuart St
- 2636 Stuart St
- 2733 Benvenue Ave
- 2647 Stuart St
- 2640 Stuart St
- 2638 Stuart St Unit A
- 2805 Benvenue Ave
- 2742 Benvenue Ave
- 2738 Benvenue Ave
- 2620 Stuart St
- 2731 Benvenue Ave
- 2742 College Ave
- 2734 Benvenue Ave
- 2736 College Ave
- 2804 Benvenue Ave
Ask me questions while you tour the home.