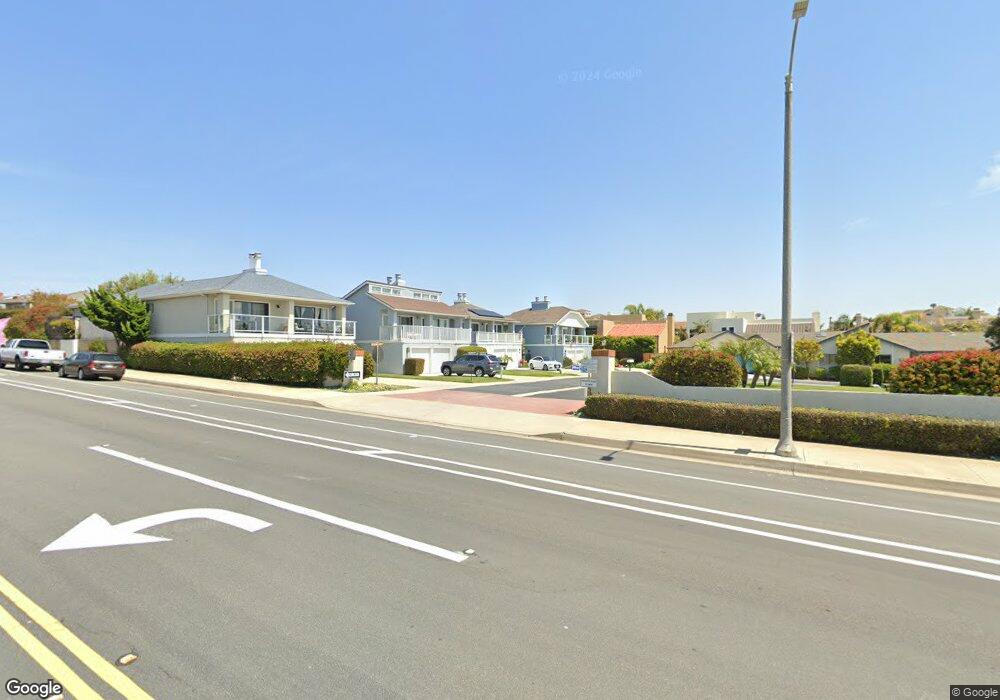
27405 Capistrano Bluffs Rd Capistrano Beach, CA 92624
Estimated Value: $1,294,417 - $2,024,000
3
Beds
2
Baths
1,756
Sq Ft
$940/Sq Ft
Est. Value
About This Home
This home is located at 27405 Capistrano Bluffs Rd, Capistrano Beach, CA 92624 and is currently estimated at $1,650,104, approximately $939 per square foot. 27405 Capistrano Bluffs Rd is a home located in Orange County with nearby schools including Palisades Elementary School, Shorecliffs Middle School, and San Clemente High School.
Ownership History
Date
Name
Owned For
Owner Type
Purchase Details
Closed on
Feb 28, 2020
Sold by
White James Radford and White Cecilia A
Bought by
White James R and White Cecilia
Current Estimated Value
Purchase Details
Closed on
Aug 2, 2011
Sold by
Backman David L and Backman Elinor E
Bought by
White James Radford and White Cecilia A
Home Financials for this Owner
Home Financials are based on the most recent Mortgage that was taken out on this home.
Original Mortgage
$425,000
Outstanding Balance
$292,752
Interest Rate
4.46%
Mortgage Type
Seller Take Back
Estimated Equity
$1,357,352
Purchase Details
Closed on
Jan 20, 1998
Sold by
Backman David L and Backman Elinor E
Bought by
Backman David L and Backman Elinor E
Create a Home Valuation Report for This Property
The Home Valuation Report is an in-depth analysis detailing your home's value as well as a comparison with similar homes in the area
Home Values in the Area
Average Home Value in this Area
Purchase History
| Date | Buyer | Sale Price | Title Company |
|---|---|---|---|
| White James R | -- | None Available | |
| White James Radford | $575,000 | First American Title | |
| Backman David L | -- | -- |
Source: Public Records
Mortgage History
| Date | Status | Borrower | Loan Amount |
|---|---|---|---|
| Open | White James Radford | $425,000 |
Source: Public Records
Tax History
| Year | Tax Paid | Tax Assessment Tax Assessment Total Assessment is a certain percentage of the fair market value that is determined by local assessors to be the total taxable value of land and additions on the property. | Land | Improvement |
|---|---|---|---|---|
| 2025 | $8,784 | $722,225 | $559,269 | $162,956 |
| 2024 | $8,784 | $708,064 | $548,303 | $159,761 |
| 2023 | $8,484 | $694,181 | $537,552 | $156,629 |
| 2022 | $8,217 | $680,570 | $527,012 | $153,558 |
| 2021 | $8,122 | $667,226 | $516,678 | $150,548 |
| 2020 | $7,903 | $660,385 | $511,380 | $149,005 |
| 2019 | $7,692 | $647,437 | $501,353 | $146,084 |
| 2018 | $7,503 | $634,743 | $491,523 | $143,220 |
| 2017 | $7,309 | $622,298 | $481,886 | $140,412 |
| 2016 | $7,116 | $610,097 | $472,438 | $137,659 |
| 2015 | $6,841 | $600,933 | $465,341 | $135,592 |
| 2014 | $6,724 | $589,162 | $456,226 | $132,936 |
Source: Public Records
Map
Nearby Homes
- 35322 Camino Capistrano
- 35311 Camino Capistrano
- 3281 Paseo Gallita
- 454 Camino Alondra
- 35242 Vista de Todo
- 35577 Beach Rd
- 35461 Beach Rd
- 376 Calle Borrego
- 35471 Camino Capistrano
- 3315 Paseo Halcon
- 3326 Paseo Halcon
- 35661 Beach Rd
- 266 Del Gado Rd
- 27112 Mill Pond Rd Unit 2
- 35711 Beach Rd
- 429 Plaza Estival
- 490 Plaza Estival
- 484 Plaza Estival
- 35171 Beach Rd
- 229 Monte Vista Unit 12
- 27401 Capistrano Bluffs Rd
- 5 Calle Prima
- 27395 Capistrano Bluffs Rd
- 6 Calle Prima
- 4 Calle Prima
- 27391 Capistrano Bluffs Rd
- 27408 Capistrano Bluffs Rd
- 27521 Via Saratoga
- 3226 Paseo Gallita
- 3228 Paseo Gallita
- 3230 Paseo Gallita
- 3232 Paseo Gallita
- 3224 Paseo Gallita
- 27531 Via Saratoga
- 3 Calle Prima
- 3234 Paseo Gallita
- 27511 Via Saratoga
- 3222 Paseo Gallita
- 3236 Paseo Gallita
- 27381 Vista Azul
Your Personal Tour Guide
Ask me questions while you tour the home.