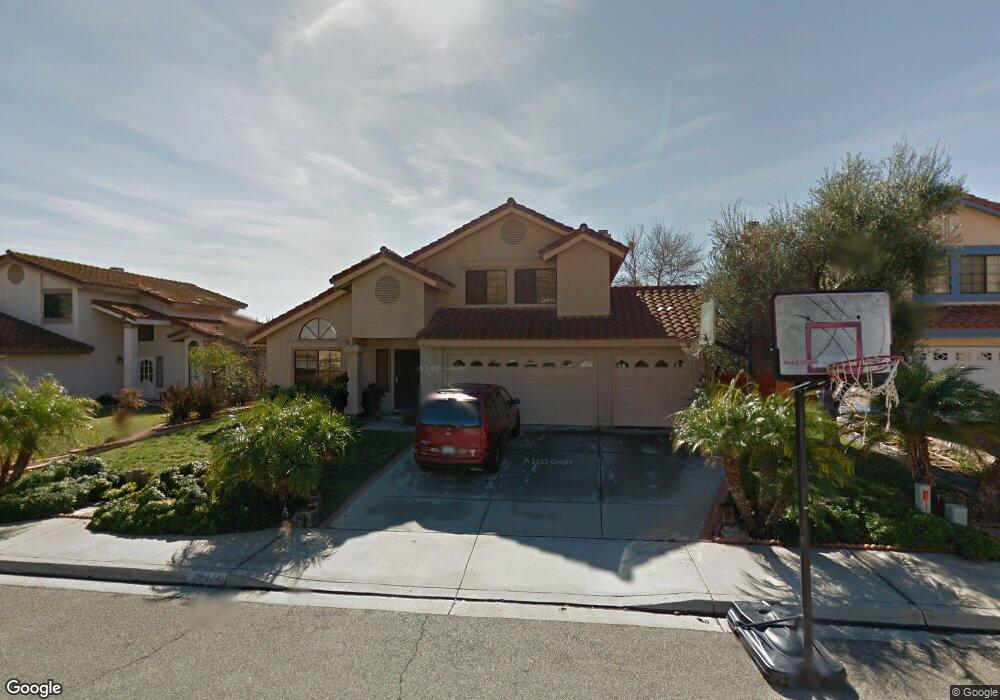
2741 Fieldbrook Way Escondido, CA 92027
East Grove NeighborhoodEstimated Value: $849,000 - $897,000
3
Beds
3
Baths
1,856
Sq Ft
$470/Sq Ft
Est. Value
About This Home
This home is located at 2741 Fieldbrook Way, Escondido, CA 92027 and is currently estimated at $872,451, approximately $470 per square foot. 2741 Fieldbrook Way is a home located in San Diego County with nearby schools including Glen View Elementary School, Hidden Valley Middle School, and Orange Glen High School.
Ownership History
Date
Name
Owned For
Owner Type
Purchase Details
Closed on
Jan 14, 2021
Sold by
Tamayo Heriberto A
Bought by
Tamayo Heriberto A and Cervantes Cristina E
Current Estimated Value
Purchase Details
Closed on
Aug 22, 2003
Sold by
Tamayo Heriberto A and Tamayo Sylvia
Bought by
Tamayo Heriberto A
Home Financials for this Owner
Home Financials are based on the most recent Mortgage that was taken out on this home.
Original Mortgage
$200,000
Outstanding Balance
$89,672
Interest Rate
5.87%
Mortgage Type
Unknown
Estimated Equity
$782,779
Purchase Details
Closed on
Apr 11, 1996
Sold by
Chakiris James L
Bought by
Tamayo Heriberto A and Tamayo Sylvia
Home Financials for this Owner
Home Financials are based on the most recent Mortgage that was taken out on this home.
Original Mortgage
$133,600
Interest Rate
7.41%
Purchase Details
Closed on
Aug 5, 1988
Create a Home Valuation Report for This Property
The Home Valuation Report is an in-depth analysis detailing your home's value as well as a comparison with similar homes in the area
Home Values in the Area
Average Home Value in this Area
Purchase History
| Date | Buyer | Sale Price | Title Company |
|---|---|---|---|
| Tamayo Heriberto A | -- | None Available | |
| Tamayo Heriberto A | -- | Chicago Title Co | |
| Tamayo Heriberto A | $167,000 | Chicago Title Co | |
| -- | $167,500 | -- |
Source: Public Records
Mortgage History
| Date | Status | Borrower | Loan Amount |
|---|---|---|---|
| Open | Tamayo Heriberto A | $200,000 | |
| Closed | Tamayo Heriberto A | $133,600 |
Source: Public Records
Tax History Compared to Growth
Tax History
| Year | Tax Paid | Tax Assessment Tax Assessment Total Assessment is a certain percentage of the fair market value that is determined by local assessors to be the total taxable value of land and additions on the property. | Land | Improvement |
|---|---|---|---|---|
| 2025 | $3,211 | $284,372 | $78,065 | $206,307 |
| 2024 | $3,211 | $278,797 | $76,535 | $202,262 |
| 2023 | $3,138 | $273,332 | $75,035 | $198,297 |
| 2022 | $3,105 | $267,973 | $73,564 | $194,409 |
| 2021 | $3,055 | $262,720 | $72,122 | $190,598 |
| 2020 | $3,037 | $260,027 | $71,383 | $188,644 |
| 2019 | $2,964 | $254,930 | $69,984 | $184,946 |
| 2018 | $2,882 | $249,932 | $68,612 | $181,320 |
| 2017 | $2,836 | $245,032 | $67,267 | $177,765 |
| 2016 | $2,781 | $240,229 | $65,949 | $174,280 |
| 2015 | $2,758 | $236,622 | $64,959 | $171,663 |
| 2014 | $2,645 | $231,988 | $63,687 | $168,301 |
Source: Public Records
Map
Nearby Homes
- 705 Sungold Way
- 770 Sungold Way
- 2561 White Oak Place Unit 1
- 2469 Turnbridge Glen
- 609 Jacks Creek Rd
- 629 Pitman St
- 472 Devonshire Glen
- 2928 Burnet Dr
- 2700 E Valley Pkwy Unit 189
- 2700 E Valley Pkwy Unit Spc 81
- 2700 E Valley Pkwy Unit 315
- 2700 E Valley Pkwy Unit 64
- 2402 Honeybell Ln
- 2700e Valley Pkwy Unit 81
- 2428 Monroe Place
- 2550 E Valley Pkwy Unit 122
- 840 Paula St
- 2313 E Lincoln Ave
- 2141 E Mission Ave
- 2300 E Valley Pkwy Unit 194
- 2751 Fieldbrook Way
- 2731 Fieldbrook Way
- 2761 Fieldbrook Way
- 2721 Fieldbrook Way Unit HOUSE
- 2721 Fieldbrook Way
- 2740 Fieldbrook Way
- 2730 Fieldbrook Way
- 2750 Fieldbrook Way
- 2711 Fieldbrook Way
- 2720 Fieldbrook Way
- 2612 E Washington Ave
- 2661 Minneola Ln
- 2695 Pummelo Ct
- 2770 Fieldbrook Way
- 2710 Fieldbrook Way
- 2771 Fieldbrook Way
- 2701 Fieldbrook Way
- 2759 Prairiestone Way
- 2769 Prairiestone Way
- 2749 Prairiestone Way