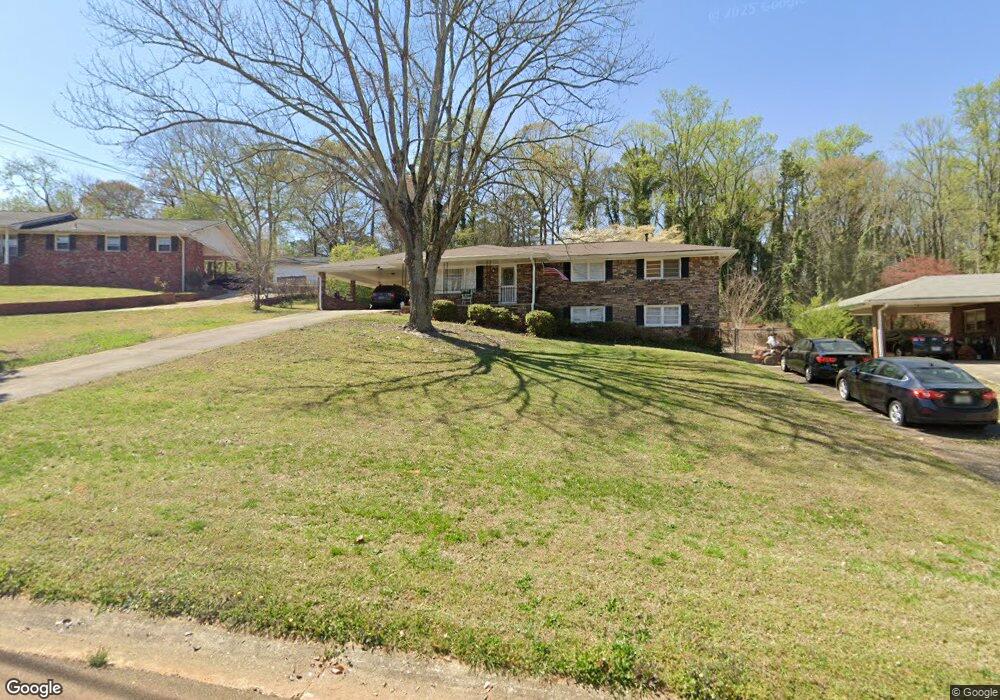
2741 Old Carriage Dr SW Marietta, GA 30060
Southwestern Marietta NeighborhoodEstimated Value: $305,427 - $353,000
3
Beds
2
Baths
1,300
Sq Ft
$252/Sq Ft
Est. Value
About This Home
This home is located at 2741 Old Carriage Dr SW, Marietta, GA 30060 and is currently estimated at $327,607, approximately $252 per square foot. 2741 Old Carriage Dr SW is a home located in Cobb County with nearby schools including Birney Elementary School, Floyd Middle School, and Osborne High School.
Ownership History
Date
Name
Owned For
Owner Type
Purchase Details
Closed on
Nov 13, 2020
Sold by
Ackermann Kurt
Bought by
Ackermann Tara L
Current Estimated Value
Home Financials for this Owner
Home Financials are based on the most recent Mortgage that was taken out on this home.
Original Mortgage
$120,000
Outstanding Balance
$106,362
Interest Rate
2.71%
Mortgage Type
New Conventional
Estimated Equity
$221,245
Purchase Details
Closed on
Jul 6, 2006
Sold by
Preferred Homebuyers Llc
Bought by
Ackerman Tara L and Ackerman Kurt
Home Financials for this Owner
Home Financials are based on the most recent Mortgage that was taken out on this home.
Original Mortgage
$100,000
Interest Rate
6.55%
Mortgage Type
New Conventional
Purchase Details
Closed on
Jun 15, 2006
Sold by
Futrelle Peggy G
Bought by
Preferred Homebuyers Llc
Home Financials for this Owner
Home Financials are based on the most recent Mortgage that was taken out on this home.
Original Mortgage
$100,000
Interest Rate
6.55%
Mortgage Type
New Conventional
Create a Home Valuation Report for This Property
The Home Valuation Report is an in-depth analysis detailing your home's value as well as a comparison with similar homes in the area
Home Values in the Area
Average Home Value in this Area
Purchase History
| Date | Buyer | Sale Price | Title Company |
|---|---|---|---|
| Ackermann Tara L | -- | None Available | |
| Ackerman Tara L | $125,000 | -- | |
| Preferred Homebuyers Llc | $100,000 | -- |
Source: Public Records
Mortgage History
| Date | Status | Borrower | Loan Amount |
|---|---|---|---|
| Open | Ackermann Tara L | $120,000 | |
| Closed | Ackerman Tara L | $100,000 | |
| Closed | Preferred Homebuyers Llc | $112,500 |
Source: Public Records
Tax History Compared to Growth
Tax History
| Year | Tax Paid | Tax Assessment Tax Assessment Total Assessment is a certain percentage of the fair market value that is determined by local assessors to be the total taxable value of land and additions on the property. | Land | Improvement |
|---|---|---|---|---|
| 2025 | $3,522 | $116,888 | $14,000 | $102,888 |
| 2024 | $3,524 | $116,888 | $14,000 | $102,888 |
| 2023 | $3,524 | $116,888 | $14,000 | $102,888 |
| 2022 | $2,705 | $89,124 | $14,000 | $75,124 |
| 2021 | $2,260 | $74,480 | $14,000 | $60,480 |
| 2020 | $2,036 | $67,096 | $14,000 | $53,096 |
| 2019 | $1,753 | $57,748 | $14,000 | $43,748 |
| 2018 | $1,753 | $57,748 | $14,000 | $43,748 |
| 2017 | $1,322 | $45,968 | $9,600 | $36,368 |
| 2016 | $1,129 | $39,260 | $11,200 | $28,060 |
| 2015 | $1,157 | $39,260 | $11,200 | $28,060 |
| 2014 | $906 | $30,484 | $0 | $0 |
Source: Public Records
Map
Nearby Homes
- 444 White Oak Dr SW
- 3065 Moser Way
- 3090 Moser Way
- 430 Church Rd SW
- 2946 Oshields Ct SW Unit 3
- 2780 Northwood Ct SW
- 187 Timber Creek Ln SW
- 2896 Oshields Ct SW Unit 1
- 537 Shay Dr SW Unit 9
- 2777 Northwood Ct SW
- 2969 Favor Rd SW Unit 1
- 174 Timber Creek Ln SW Unit 176
- 3306 Harrow Ct SW
- 244 Timber Creek Ln SW
- 154 Timber Creek Ln SW Unit 1
- 2896 Lakemont Dr SW
- 2898 Lakemont Dr SW
- 3241 Wildwood Dr SW
- 2755 Old Carriage Dr SW
- 2739 Old Carriage Dr SW
- 0 Old Carriage Dr SW Unit 8818458
- 0 Old Carriage Dr SW Unit 8756130
- 0 Old Carriage Dr SW Unit 8370953
- 0 Old Carriage Dr SW Unit 8264606
- 0 Old Carriage Dr SW Unit 8194546
- 0 Old Carriage Dr SW Unit 7639458
- 2765 Old Carriage Dr SW
- 2740 Old Carriage Dr SW
- 356 Smyrn Pdr Spgs Rd SW
- 356 Smyrna Powder Springs Rd SW
- 368 Smyrn Pdr Spgs Rd SW Unit 3
- 368 Smyrna Powder Springs Rd SW
- 2760 Old Carriage Dr SW
- 422 White Oak Dr SW
- 2730 Old Carriage Dr SW
- 420 White Oak Dr SW
- 0 Moser Way
- 0 Moser Way Unit 7194096