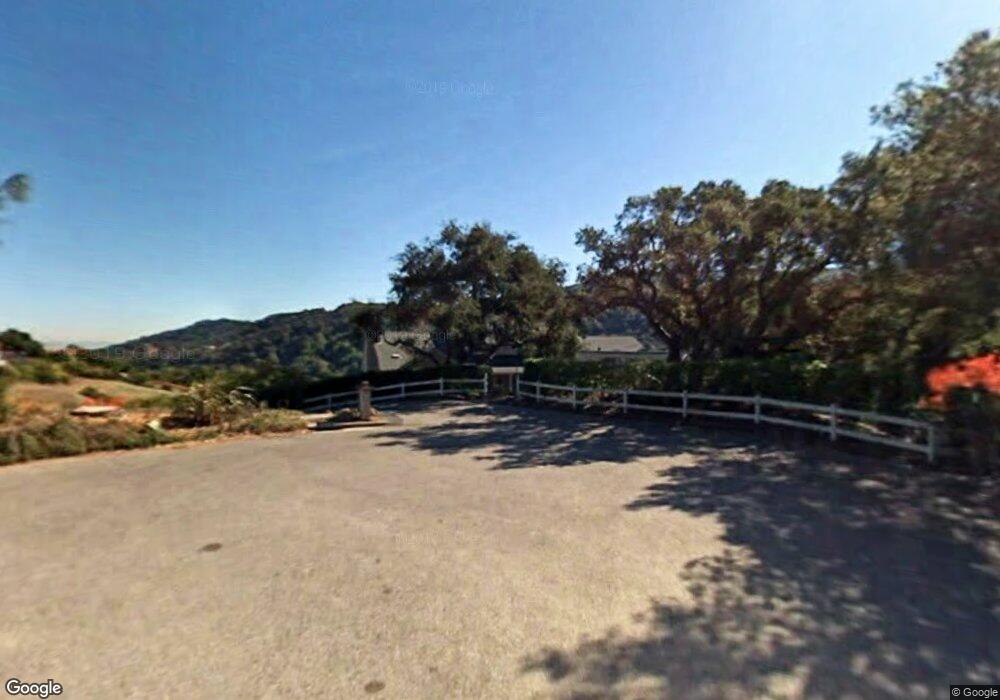
27420 Deer Springs Way Los Altos Hills, CA 94022
Estimated Value: $4,997,000 - $5,346,000
5
Beds
3
Baths
3,538
Sq Ft
$1,446/Sq Ft
Est. Value
About This Home
This home is located at 27420 Deer Springs Way, Los Altos Hills, CA 94022 and is currently estimated at $5,115,739, approximately $1,445 per square foot. 27420 Deer Springs Way is a home located in Santa Clara County with nearby schools including Gardner Bullis Elementary School, Ardis G. Egan Junior High School, and Los Altos High School.
Ownership History
Date
Name
Owned For
Owner Type
Purchase Details
Closed on
Mar 25, 2021
Sold by
Newsum Hsi An and Newsum Jack G
Bought by
Newsum Hsi An and Survivors Tr Under Jack G News
Current Estimated Value
Purchase Details
Closed on
Mar 23, 2021
Sold by
Newsum Jack Gene
Bought by
Jack G Newsum And Hsi-Ann Newsum Living and Newsum
Purchase Details
Closed on
Dec 4, 2012
Sold by
Newsum Jack G and Newsum Hsi An
Bought by
Newsum Jack G and Newsum Hsi An
Home Financials for this Owner
Home Financials are based on the most recent Mortgage that was taken out on this home.
Original Mortgage
$700,000
Interest Rate
3%
Mortgage Type
New Conventional
Purchase Details
Closed on
Nov 21, 1999
Sold by
Newsum Jack G and An Hsi
Bought by
Newsum Jack G and Newsum Hsi An
Purchase Details
Closed on
Nov 18, 1996
Sold by
Newsum Jack G
Bought by
Newsum Jack G and Newsum Hsi An
Home Financials for this Owner
Home Financials are based on the most recent Mortgage that was taken out on this home.
Original Mortgage
$156,000
Interest Rate
7.91%
Mortgage Type
Purchase Money Mortgage
Create a Home Valuation Report for This Property
The Home Valuation Report is an in-depth analysis detailing your home's value as well as a comparison with similar homes in the area
Home Values in the Area
Average Home Value in this Area
Purchase History
| Date | Buyer | Sale Price | Title Company |
|---|---|---|---|
| Newsum Hsi An | -- | None Available | |
| Jack G Newsum And Hsi-Ann Newsum Living | -- | -- | |
| Newsum Jack G | -- | Chicago Title | |
| Newsum Jack G | -- | Chicago Title Company | |
| Newsum Jack G | -- | -- | |
| Newsum Jack G | -- | Old Republic Title Company |
Source: Public Records
Mortgage History
| Date | Status | Borrower | Loan Amount |
|---|---|---|---|
| Previous Owner | Newsum Jack G | $700,000 | |
| Previous Owner | Newsum Jack G | $156,000 |
Source: Public Records
Tax History Compared to Growth
Tax History
| Year | Tax Paid | Tax Assessment Tax Assessment Total Assessment is a certain percentage of the fair market value that is determined by local assessors to be the total taxable value of land and additions on the property. | Land | Improvement |
|---|---|---|---|---|
| 2025 | $6,931 | $441,167 | $73,431 | $367,736 |
| 2024 | $6,931 | $432,518 | $71,992 | $360,526 |
| 2023 | $6,768 | $424,038 | $70,581 | $353,457 |
| 2022 | $6,625 | $415,725 | $69,198 | $346,527 |
| 2021 | $6,554 | $407,575 | $67,842 | $339,733 |
| 2020 | $6,591 | $403,397 | $67,147 | $336,250 |
| 2019 | $6,347 | $395,488 | $65,831 | $329,657 |
| 2018 | $6,256 | $387,735 | $64,541 | $323,194 |
| 2017 | $6,033 | $380,133 | $63,276 | $316,857 |
| 2016 | $5,878 | $372,681 | $62,036 | $310,645 |
| 2015 | $5,410 | $367,084 | $61,105 | $305,979 |
| 2014 | $5,073 | $359,895 | $59,909 | $299,986 |
Source: Public Records
Map
Nearby Homes
- 26873 Moody Rd
- 26385 Altamont Rd
- 27000 Almaden Ct
- 27388 Sherlock Ct
- 27500 La Vida Real
- 0 Arroyo Way Unit ML81991983
- 11860 Francemont Dr
- 27464 Altamont Rd
- 12130 Foothill Ln
- 25751 Elena Rd
- 3875 Page Mill Rd
- 28025 Natoma Rd
- 0 Moody Rd
- 28500 Matadero Creek Ln
- 28140 Story Hill Ln
- 12911 Atherton Ct
- 12675 La Cresta Dr
- 12008 Emerald Hill Ln
- 12750 Canario Way
- 2987 Alexis Dr
- 27431 Deer Springs Way
- 27408 Deer Springs Way
- 27413 Deer Springs Way
- 27390 Deer Springs Way
- 27369 Chaparral Way
- 27385 Deer Springs Way
- 27359 Julietta Ln
- 27345 Deer Springs Way
- 27339 Julietta Ln
- 27330 Deer Springs Way
- 27349 Julietta Ln
- 27319 Julietta Ln
- 27370 Julietta Ln
- 27300 Deer Springs Way
- 27305 Deer Springs Way
- 27360 Julietta Ln
- 27309 Julietta Ln
- 27350 Julietta Ln
- 27275 Julietta Ln
- 27320 Julietta Ln