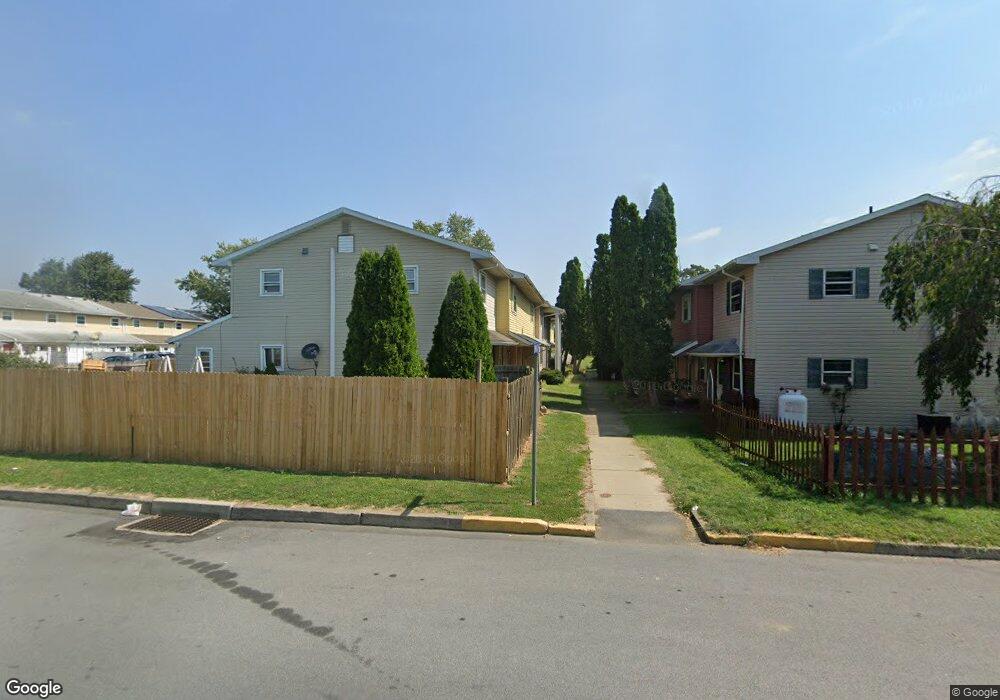
2743 Donna Jo Way Allentown, PA 18109
Estimated Value: $207,000 - $225,000
3
Beds
2
Baths
1,304
Sq Ft
$165/Sq Ft
Est. Value
About This Home
This home is located at 2743 Donna Jo Way, Allentown, PA 18109 and is currently estimated at $214,783, approximately $164 per square foot. 2743 Donna Jo Way is a home located in Lehigh County with nearby schools including Francis H Sheckler Elementary School, Catasauqua Middle School, and Catasauqua Senior High School.
Ownership History
Date
Name
Owned For
Owner Type
Purchase Details
Closed on
Oct 12, 2017
Sold by
Collins Harold L and Collins Sylvia A
Bought by
Matz Charles M and Crockett Howard E
Current Estimated Value
Home Financials for this Owner
Home Financials are based on the most recent Mortgage that was taken out on this home.
Original Mortgage
$68,732
Outstanding Balance
$57,349
Interest Rate
3.78%
Mortgage Type
FHA
Estimated Equity
$157,434
Purchase Details
Closed on
Feb 28, 1997
Sold by
Sierzega Thomas J and Carol Ann
Bought by
Collins Ii Harold L and Collins Sylvia A
Purchase Details
Closed on
Jan 28, 1993
Sold by
Klinger Carol Ann
Bought by
Sierzega Thomas J and Carol Ann
Purchase Details
Closed on
Mar 21, 1989
Sold by
Kerecz Diane M
Bought by
Klinger Carol Ann
Purchase Details
Closed on
Feb 13, 1987
Sold by
Flood Terrane
Bought by
Kerecz Diane M
Purchase Details
Closed on
Oct 11, 1979
Bought by
Flood Terrane
Create a Home Valuation Report for This Property
The Home Valuation Report is an in-depth analysis detailing your home's value as well as a comparison with similar homes in the area
Home Values in the Area
Average Home Value in this Area
Purchase History
| Date | Buyer | Sale Price | Title Company |
|---|---|---|---|
| Matz Charles M | $70,000 | None Available | |
| Collins Ii Harold L | $57,900 | -- | |
| Sierzega Thomas J | -- | -- | |
| Klinger Carol Ann | $62,000 | -- | |
| Kerecz Diane M | $42,500 | -- | |
| Flood Terrane | $32,000 | -- |
Source: Public Records
Mortgage History
| Date | Status | Borrower | Loan Amount |
|---|---|---|---|
| Open | Matz Charles M | $68,732 |
Source: Public Records
Tax History Compared to Growth
Tax History
| Year | Tax Paid | Tax Assessment Tax Assessment Total Assessment is a certain percentage of the fair market value that is determined by local assessors to be the total taxable value of land and additions on the property. | Land | Improvement |
|---|---|---|---|---|
| 2025 | $2,391 | $93,600 | $5,500 | $88,100 |
| 2024 | $2,304 | $93,600 | $5,500 | $88,100 |
| 2023 | $2,310 | $93,600 | $5,500 | $88,100 |
| 2022 | $2,221 | $93,600 | $88,100 | $5,500 |
| 2021 | $2,221 | $93,600 | $5,500 | $88,100 |
| 2020 | $2,188 | $93,600 | $5,500 | $88,100 |
| 2019 | $2,123 | $93,600 | $5,500 | $88,100 |
| 2018 | $1,977 | $93,600 | $5,500 | $88,100 |
| 2017 | $1,927 | $93,600 | $5,500 | $88,100 |
| 2016 | -- | $93,600 | $5,500 | $88,100 |
| 2015 | -- | $93,600 | $5,500 | $88,100 |
| 2014 | -- | $93,600 | $5,500 | $88,100 |
Source: Public Records
Map
Nearby Homes
- 2152 Blossom Ln
- 1285 Stafore Dr
- 2126 Herbert Dr
- 2141 Catasauqua Rd
- 2229 Vista Dr
- 2035 Drury Ln
- 1929 Cloverdale Rd
- 1490 Orchard Ln
- 1215 Ciara Dr
- 1215 W MacAda Rd
- 4064 Autumn Ridge Rd
- 3760 Jacksonville Rd
- 1556 Bayberry Ln
- 1445 Westgate Dr
- 1225 Brentwood Ave
- 809 Overlook Dr
- 2520 Winston Rd
- 1918 Pinehurst Rd
- 6075 Airport Rd
- 960 Yorkshire Rd
- 2747 Donna Jo Way
- 2739 Donna Jo Way
- 2739 Donna Jo Way Unit 1
- 2751 Donna Jo Way
- 2755 Donna Jo Way
- 2745 Donna Jo Way
- 2741 Donna Jo Way
- 2749 Donna Jo Way
- 2759 Donna Jo Way
- 2737 Donna Jo Way
- 2753 Donna Jo Way
- 2763 Donna Jo Way
- 2757 Donna Jo Way
- 2761 Donna Jo Way
- 2769 Joanne Marie Way
- 2773 Joanne Marie Way
- 2777 Joanne Marie Way
- 2767 Donna Jo Way
- 2781 Joanne Marie Way
- 2789 Joanne Marie Way