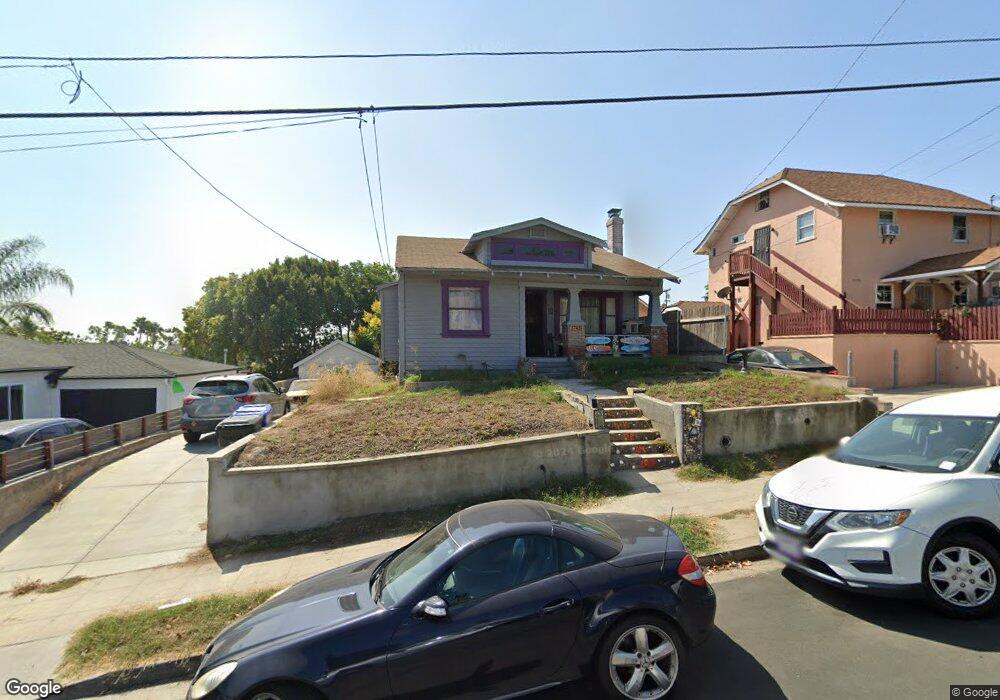
2743 E St San Diego, CA 92102
Golden Hill NeighborhoodEstimated Value: $579,000 - $928,000
3
Beds
1
Bath
990
Sq Ft
$779/Sq Ft
Est. Value
About This Home
This home is located at 2743 E St, San Diego, CA 92102 and is currently estimated at $771,126, approximately $778 per square foot. 2743 E St is a home located in San Diego County with nearby schools including Golden Hill Elementary School, Roosevelt International Middle School, and Albert Einstein Academy.
Ownership History
Date
Name
Owned For
Owner Type
Purchase Details
Closed on
Dec 12, 2017
Current Estimated Value
Purchase Details
Closed on
May 15, 2000
Home Financials for this Owner
Home Financials are based on the most recent Mortgage that was taken out on this home.
Original Mortgage
$113,600
Outstanding Balance
$37,360
Interest Rate
8.53%
Estimated Equity
$733,766
Purchase Details
Closed on
Oct 4, 1996
Create a Home Valuation Report for This Property
The Home Valuation Report is an in-depth analysis detailing your home's value as well as a comparison with similar homes in the area
Home Values in the Area
Average Home Value in this Area
Purchase History
| Date | Buyer | Sale Price | Title Company |
|---|---|---|---|
| -- | -- | None Available | |
| -- | $142,000 | Commonwealth Land Title Co | |
| -- | -- | -- |
Source: Public Records
Mortgage History
| Date | Status | Borrower | Loan Amount |
|---|---|---|---|
| Open | -- | $113,600 |
Source: Public Records
Tax History
| Year | Tax Paid | Tax Assessment Tax Assessment Total Assessment is a certain percentage of the fair market value that is determined by local assessors to be the total taxable value of land and additions on the property. | Land | Improvement |
|---|---|---|---|---|
| 2025 | $2,715 | $218,222 | $163,683 | $54,539 |
| 2024 | $2,715 | $213,944 | $160,474 | $53,470 |
| 2023 | $2,650 | $209,750 | $157,328 | $52,422 |
| 2022 | $2,581 | $205,639 | $154,244 | $51,395 |
| 2021 | $2,561 | $201,608 | $151,220 | $50,388 |
| 2020 | $2,529 | $199,542 | $149,670 | $49,872 |
| 2019 | $2,486 | $195,631 | $146,736 | $48,895 |
| 2018 | $2,326 | $191,796 | $143,859 | $47,937 |
| 2017 | $80 | $188,037 | $141,039 | $46,998 |
| 2016 | $2,233 | $184,351 | $138,274 | $46,077 |
| 2015 | $2,201 | $181,582 | $136,197 | $45,385 |
| 2014 | $2,167 | $178,026 | $133,530 | $44,496 |
Source: Public Records
Map
Nearby Homes
- 801 27th St
- 762 Cerro Gordo Ave
- 2774-80 W Broadway
- 2663-67 E St
- 2650 Broadway Unit 110
- 918-32 27th St Unit 918-32
- 918-32 27th St
- 2804 C St
- 2762 Market St
- 2934 F St
- 2875 B St
- 2891 B St
- 2715 A St
- 2560 C St Unit 15
- 2950 Broadway Unit 16
- 913 25th St
- 2849 A St
- 1002 30th St Unit 106
- 2629 Island Ave
- 3029 Broadway Unit 4
Your Personal Tour Guide
Ask me questions while you tour the home.