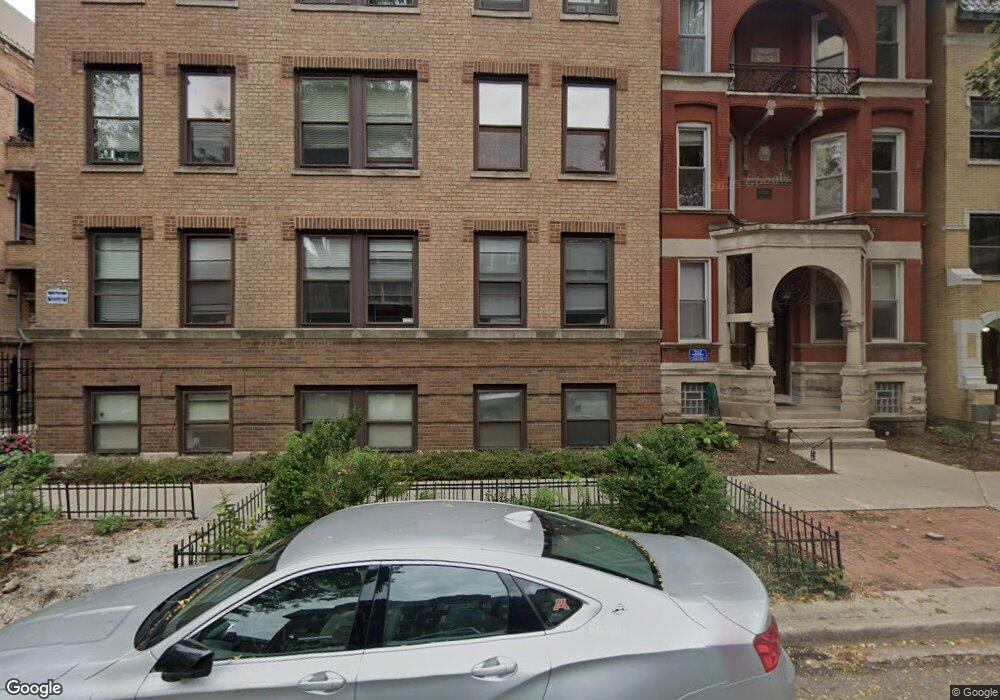
2743 N Hampden Ct Unit 27432W Chicago, IL 60614
Lincoln Park NeighborhoodEstimated Value: $381,000 - $418,000
2
Beds
1
Bath
--
Sq Ft
0.29
Acres
About This Home
This home is located at 2743 N Hampden Ct Unit 27432W, Chicago, IL 60614 and is currently estimated at $400,142. 2743 N Hampden Ct Unit 27432W is a home located in Cook County with nearby schools including Alcott Elementary School, Lincoln Park High School, and Saint Clement School.
Ownership History
Date
Name
Owned For
Owner Type
Purchase Details
Closed on
Apr 5, 2022
Sold by
Norbutt Keith A
Bought by
Evavold Whitney A
Current Estimated Value
Home Financials for this Owner
Home Financials are based on the most recent Mortgage that was taken out on this home.
Original Mortgage
$271,200
Outstanding Balance
$255,841
Interest Rate
4.67%
Estimated Equity
$144,301
Purchase Details
Closed on
Mar 21, 2022
Sold by
Norbutt Keith A
Bought by
Evavold Whitney A
Home Financials for this Owner
Home Financials are based on the most recent Mortgage that was taken out on this home.
Original Mortgage
$271,200
Outstanding Balance
$255,841
Interest Rate
4.67%
Estimated Equity
$144,301
Purchase Details
Closed on
Sep 28, 2007
Sold by
Rozanski Sharon J
Bought by
Norbutt Keith A
Home Financials for this Owner
Home Financials are based on the most recent Mortgage that was taken out on this home.
Original Mortgage
$221,625
Interest Rate
6.55%
Mortgage Type
Unknown
Create a Home Valuation Report for This Property
The Home Valuation Report is an in-depth analysis detailing your home's value as well as a comparison with similar homes in the area
Home Values in the Area
Average Home Value in this Area
Purchase History
| Date | Buyer | Sale Price | Title Company |
|---|---|---|---|
| Evavold Whitney A | $339,000 | -- | |
| Evavold Whitney A | $339,000 | Baird & Warner Title | |
| Norbutt Keith A | $295,500 | Chicago Title Insurance Co |
Source: Public Records
Mortgage History
| Date | Status | Borrower | Loan Amount |
|---|---|---|---|
| Open | Evavold Whitney A | $271,200 | |
| Closed | Evavold Whitney A | $271,200 | |
| Previous Owner | Norbutt Keith A | $221,625 |
Source: Public Records
Tax History Compared to Growth
Tax History
| Year | Tax Paid | Tax Assessment Tax Assessment Total Assessment is a certain percentage of the fair market value that is determined by local assessors to be the total taxable value of land and additions on the property. | Land | Improvement |
|---|---|---|---|---|
| 2024 | $4,853 | $26,380 | $7,035 | $19,345 |
| 2023 | $4,027 | $23,000 | $5,666 | $17,334 |
| 2022 | $4,027 | $23,000 | $5,666 | $17,334 |
| 2021 | $3,955 | $22,999 | $5,665 | $17,334 |
| 2020 | $4,971 | $25,415 | $3,399 | $22,016 |
| 2019 | $4,829 | $27,463 | $3,399 | $24,064 |
| 2018 | $4,931 | $28,398 | $3,399 | $24,999 |
| 2017 | $4,230 | $23,023 | $3,021 | $20,002 |
| 2016 | $4,111 | $23,023 | $3,021 | $20,002 |
| 2015 | $3,738 | $23,023 | $3,021 | $20,002 |
| 2014 | $2,919 | $18,299 | $2,561 | $15,738 |
| 2013 | $2,850 | $18,299 | $2,561 | $15,738 |
Source: Public Records
Map
Nearby Homes
- 2773 N Hampden Ct Unit 401
- 2773 N Hampden Ct Unit PH03
- 2754 N Hampden Ct Unit 1706
- 2754 N Hampden Ct Unit 1003
- 2740 N Pine Grove Ave Unit 3D
- 2717 N Lehmann Ct Unit 16
- 2727 N Hampden Ct
- 2800 N Pine Grove Ave Unit 8A
- 2726 N Pine Grove Ave Unit 2726
- 2728 N Hampden Ct Unit 109
- 2728 N Hampden Ct Unit 2007
- 435 W Surf St Unit 4A
- 2650 N Lakeview Ave Unit 3101
- 2650 N Lakeview Ave Unit 404
- 415 W Surf St
- 2629 N Hampden Ct Unit 204
- 2600 N Hampden Ct Unit J1
- 340 W Diversey Pkwy Unit 2718
- 340 W Diversey Pkwy Unit 1216
- 2626 N Lakeview Ave Unit 2106
- 2743 N Hampden Ct Unit 27431E
- 2743 N Hampden Ct Unit 27431W
- 2743 N Hampden Ct Unit 27432E
- 2743 N Hampden Ct Unit 27433
- 2743 N Hampden Ct Unit 2E
- 2743 N Hampden Ct Unit 2W
- 2743 N Hampden Ct Unit 1E
- 2743 N Hampden Ct Unit 1W
- 2743 N Hampden Ct Unit 1G
- 2745 N Hampden Ct Unit 2E
- 2745 N Hampden Ct Unit 27452W
- 2745 N Hampden Ct Unit 27452E
- 2745 N Hampden Ct Unit 27453E
- 2745 N Hampden Ct Unit 27453W
- 2745 N Hampden Ct Unit 27451E
- 2745 N Hampden Ct Unit 27451W
- 2745 N Hampden Ct Unit 3W
- 2745 N Hampden Ct Unit 4EE
- 2745 N Hampden Ct Unit 4DD
- 2745 N Hampden Ct Unit 4AA